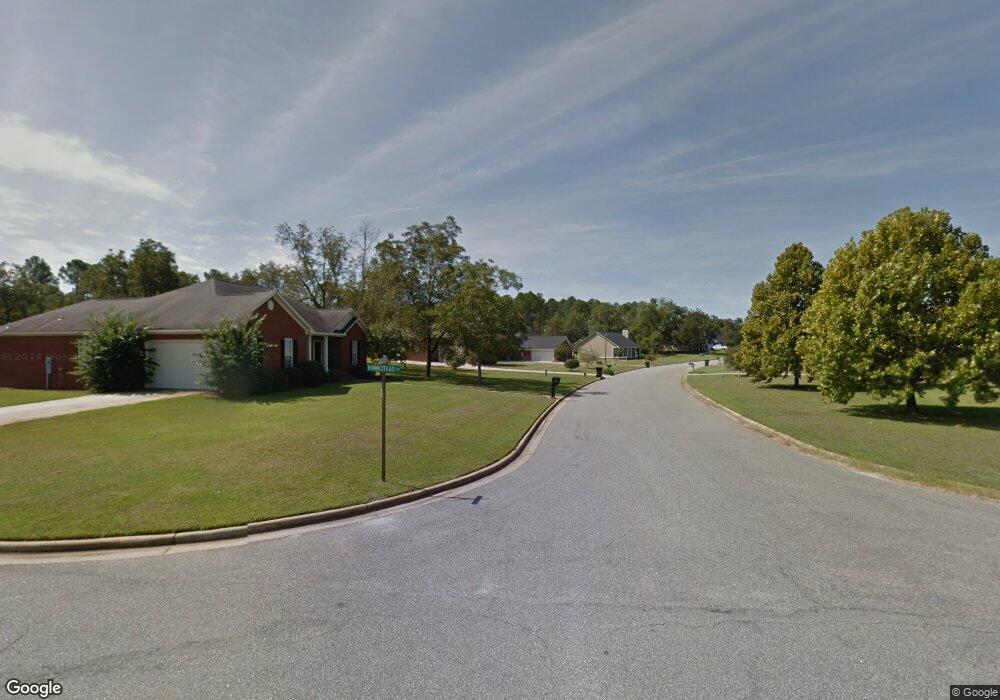
185 Ambleside Dr Leesburg, GA 31763
Estimated Value: $302,022 - $317,000
3
Beds
2
Baths
2,121
Sq Ft
$146/Sq Ft
Est. Value
About This Home
This home is located at 185 Ambleside Dr, Leesburg, GA 31763 and is currently estimated at $310,256, approximately $146 per square foot. 185 Ambleside Dr is a home located in Lee County with nearby schools including Lee County Primary School, Lee County Elementary School, and Lee County Middle School - West Campus.
Ownership History
Date
Name
Owned For
Owner Type
Purchase Details
Closed on
Apr 15, 2009
Sold by
National Residential Nominee Svcs Inc
Bought by
Wilson Robert Allen
Current Estimated Value
Home Financials for this Owner
Home Financials are based on the most recent Mortgage that was taken out on this home.
Original Mortgage
$183,870
Outstanding Balance
$117,725
Interest Rate
5.18%
Mortgage Type
VA
Estimated Equity
$192,531
Purchase Details
Closed on
Dec 9, 2008
Sold by
Stephenson Grant B
Bought by
National Residential Nominee Services
Purchase Details
Closed on
Dec 1, 2003
Sold by
Stephenson Grant B
Bought by
Stephenson Grant B
Purchase Details
Closed on
Nov 1, 2003
Sold by
Ray Lloyd Realty
Bought by
Stephenson Grant B
Purchase Details
Closed on
Jul 1, 2003
Sold by
Holly Plantation Par
Bought by
Ray Lloyd Realty
Create a Home Valuation Report for This Property
The Home Valuation Report is an in-depth analysis detailing your home's value as well as a comparison with similar homes in the area
Home Values in the Area
Average Home Value in this Area
Purchase History
| Date | Buyer | Sale Price | Title Company |
|---|---|---|---|
| Wilson Robert Allen | $180,000 | -- | |
| National Residential Nominee Services | $196,400 | -- | |
| National Residential Nominee Services In | $196,350 | -- | |
| Stephenson Grant B | -- | -- | |
| Stephenson Grant B | $169,900 | -- | |
| Ray Lloyd Realty | -- | -- |
Source: Public Records
Mortgage History
| Date | Status | Borrower | Loan Amount |
|---|---|---|---|
| Open | Wilson Robert Allen | $183,870 |
Source: Public Records
Tax History Compared to Growth
Tax History
| Year | Tax Paid | Tax Assessment Tax Assessment Total Assessment is a certain percentage of the fair market value that is determined by local assessors to be the total taxable value of land and additions on the property. | Land | Improvement |
|---|---|---|---|---|
| 2024 | $2,557 | $84,640 | $8,000 | $76,640 |
| 2023 | $2,385 | $84,640 | $8,000 | $76,640 |
| 2022 | $2,385 | $84,640 | $8,000 | $76,640 |
| 2021 | $2,389 | $84,640 | $8,000 | $76,640 |
| 2020 | $2,077 | $62,760 | $10,160 | $52,600 |
| 2019 | $2,115 | $62,760 | $10,160 | $52,600 |
| 2018 | $2,115 | $62,760 | $10,160 | $52,600 |
| 2017 | $2,003 | $62,760 | $10,160 | $52,600 |
| 2016 | $2,003 | $62,760 | $10,160 | $52,600 |
| 2015 | $2,014 | $62,760 | $10,160 | $52,600 |
| 2014 | $2,378 | $73,840 | $11,960 | $61,880 |
| 2013 | -- | $73,840 | $11,960 | $61,880 |
Source: Public Records
Map
Nearby Homes
- 112 Beowulf Ln
- 107 Beowulf Ln
- 260 Hawkstead Dr
- 307 Ambleside Dr
- 324 Ambleside Dr
- 695 Winifred Rd
- 4922 van Cise Ln
- 252 Wiregrass Way
- 123 Larkspur Dr
- 122 Bay Ct
- 2624 Crofton Dr
- 4817 Coachlight Ct
- 227 Longleaf Dr
- 2813 W Doublegate Dr
- 3811 Burton Ct
- 3806 Burton Ct
- 2511 Fox Ridge Dr
- 3805 Burton Ct
- 2507 Daylor Ct
- 2511 Daylor Ct
- 191 Ambleside Dr
- 179 Ambleside Dr
- 0 Ambleside Dr
- 199 Ambleside Dr
- 153 Hawkstead Dr
- 175 Ambleside Dr
- 147 Hawkstead Dr
- 184 Ambleside Dr
- 192 Ambleside Dr
- 188 Ambleside Dr
- 180 Ambleside Dr
- 143 Hawkstead Dr
- 171 Ambleside Dr
- 198 Ambleside Dr
- 176 Ambleside Dr
- 207 Ambleside Dr
- 139 Hawkstead Dr
- 167 Ambleside Dr
- 170 Ambleside Dr
- 175 Hawkstead Dr