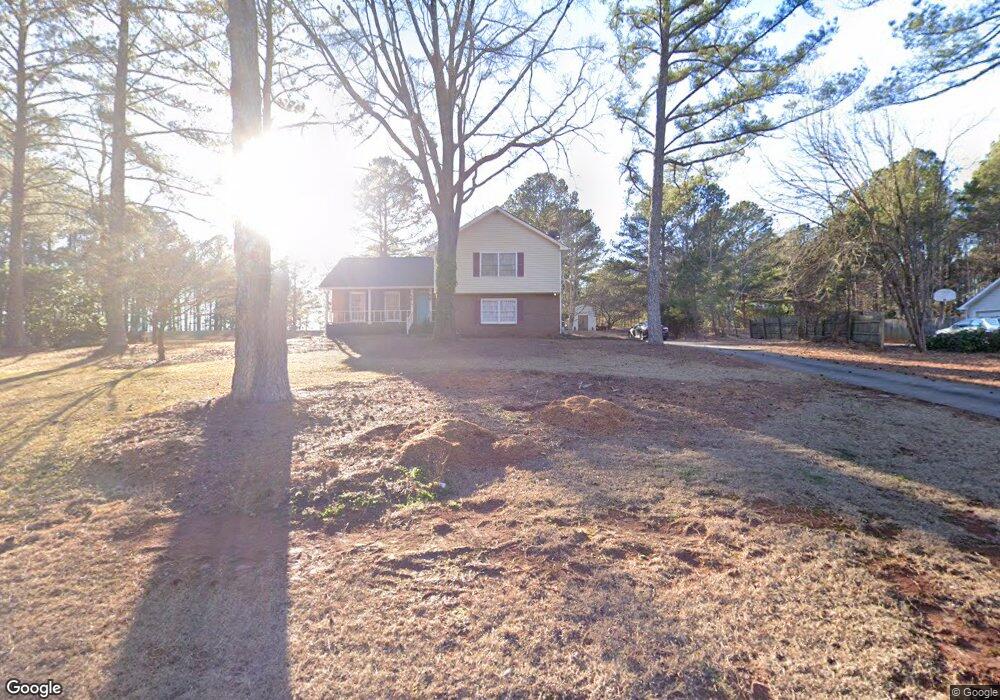
185 Bentley Way Fayetteville, GA 30214
Estimated Value: $353,000 - $374,000
4
Beds
2
Baths
2,001
Sq Ft
$180/Sq Ft
Est. Value
About This Home
This home is located at 185 Bentley Way, Fayetteville, GA 30214 and is currently estimated at $359,581, approximately $179 per square foot. 185 Bentley Way is a home located in Fayette County with nearby schools including North Fayette Elementary School, Flat Rock Middle School, and Sandy Creek High School.
Ownership History
Date
Name
Owned For
Owner Type
Purchase Details
Closed on
May 19, 2016
Sold by
Rider Nicholas D
Bought by
Brock Francys and Brock Thomas
Current Estimated Value
Home Financials for this Owner
Home Financials are based on the most recent Mortgage that was taken out on this home.
Original Mortgage
$157,102
Outstanding Balance
$127,412
Interest Rate
4.25%
Mortgage Type
FHA
Estimated Equity
$232,169
Purchase Details
Closed on
Mar 27, 2009
Sold by
2007-He3 Morgan Stanley
Bought by
Rider Nicholas D
Home Financials for this Owner
Home Financials are based on the most recent Mortgage that was taken out on this home.
Original Mortgage
$105,336
Interest Rate
5.1%
Mortgage Type
FHA
Purchase Details
Closed on
Sep 2, 2008
Sold by
Jones Paulette S
Bought by
2007-He3 Morgan Stanley
Purchase Details
Closed on
May 31, 2000
Sold by
Montgomery Mark
Bought by
Jones Paulette S
Home Financials for this Owner
Home Financials are based on the most recent Mortgage that was taken out on this home.
Original Mortgage
$111,920
Interest Rate
9.05%
Mortgage Type
New Conventional
Create a Home Valuation Report for This Property
The Home Valuation Report is an in-depth analysis detailing your home's value as well as a comparison with similar homes in the area
Home Values in the Area
Average Home Value in this Area
Purchase History
| Date | Buyer | Sale Price | Title Company |
|---|---|---|---|
| Brock Francys | $160,000 | -- | |
| Rider Nicholas D | $107,300 | -- | |
| 2007-He3 Morgan Stanley | $131,750 | -- | |
| Jones Paulette S | $139,900 | -- |
Source: Public Records
Mortgage History
| Date | Status | Borrower | Loan Amount |
|---|---|---|---|
| Open | Brock Francys | $157,102 | |
| Previous Owner | Rider Nicholas D | $105,336 | |
| Previous Owner | Jones Paulette S | $111,920 |
Source: Public Records
Tax History Compared to Growth
Tax History
| Year | Tax Paid | Tax Assessment Tax Assessment Total Assessment is a certain percentage of the fair market value that is determined by local assessors to be the total taxable value of land and additions on the property. | Land | Improvement |
|---|---|---|---|---|
| 2024 | $2,150 | $136,680 | $20,000 | $116,680 |
| 2023 | $2,150 | $131,040 | $20,000 | $111,040 |
| 2022 | $1,956 | $107,560 | $20,000 | $87,560 |
| 2021 | $1,750 | $84,320 | $20,000 | $64,320 |
| 2020 | $2,217 | $81,000 | $12,000 | $69,000 |
| 2019 | $1,727 | $63,040 | $12,000 | $51,040 |
| 2018 | $1,638 | $59,280 | $12,000 | $47,280 |
| 2017 | $1,461 | $52,960 | $12,000 | $40,960 |
| 2016 | $1,482 | $49,800 | $12,000 | $37,800 |
| 2015 | $1,409 | $46,480 | $12,000 | $34,480 |
| 2014 | $1,302 | $42,160 | $12,000 | $30,160 |
| 2013 | -- | $40,280 | $0 | $0 |
Source: Public Records
Map
Nearby Homes
- 150 Ashley Dr
- 400 Benjamin Cir Unit 3
- 100 Thornton Ct
- 210 New Oak Ridge Trail
- 100 Carlyle Ln
- 280 Benjamin Cir
- 190 Walden Way
- 130 Benjamin Cir
- 145 Walden Way Unit 2
- 615 New Hope Rd
- 615 New Hope Rd Unit NO SUBDIVISION
- 340 Magmar Ln
- 405 Fairfield Cir
- 120 Gentle Doe Dr
- 130 W Pier Way
- 919 Kite Lake Trail
- 0 Matteo Way Unit LOT 2
- 0 Matteo Way Unit LOT 32
- 0 Matteo Way Unit LOT 14
- 0 Matteo Way Unit LOT 15
- 175 Bentley Way Unit 3
- 195 Bentley Way
- 165 Bentley Way
- 205 Bentley Way Unit 5
- 150 Bentley Way
- 140 Bentley Way
- 130 Bentley Way
- 839 New Hope Rd
- 155 Bentley Way Unit 2
- 160 Bentley Way
- 215 Bentley Way Unit 5
- 120 Bentley Way
- 150 Breakwater Way
- 155 Breakwater Way
- 170 Bentley Way Unit 5
- 110 Bentley Way
- 100 Amber Ct Unit 393
- 145 Bentley Way Unit 2
- 225 Bentley Way
- 165 Ashley Dr