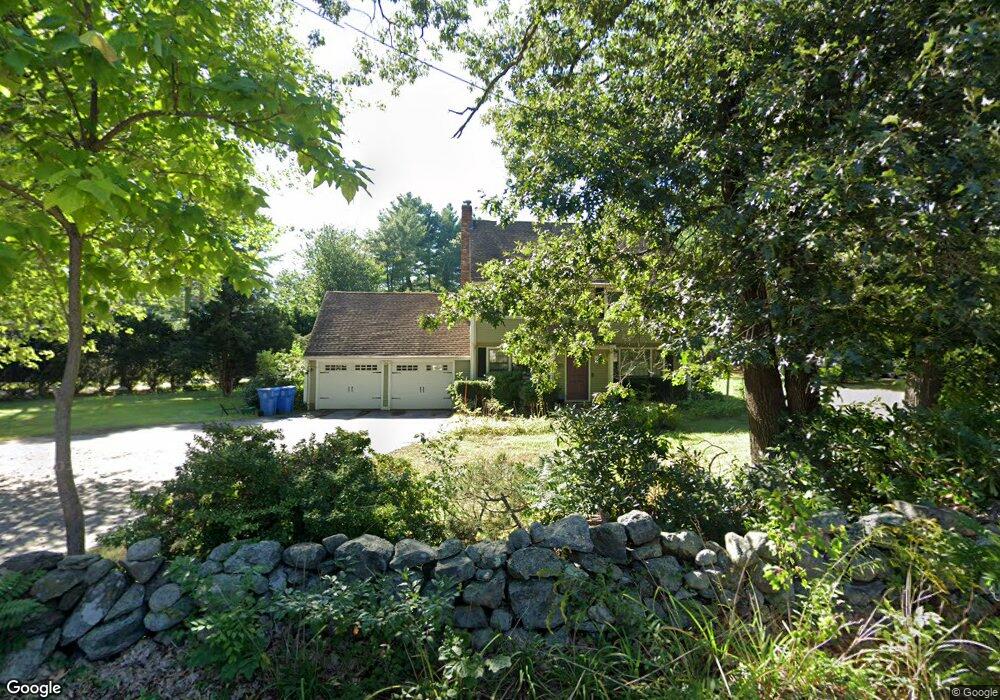
185 Chestnut St Wrentham, MA 02093
Sheldonville NeighborhoodEstimated Value: $609,000 - $787,000
4
Beds
2
Baths
1,728
Sq Ft
$407/Sq Ft
Est. Value
About This Home
This home is located at 185 Chestnut St, Wrentham, MA 02093 and is currently estimated at $702,443, approximately $406 per square foot. 185 Chestnut St is a home located in Norfolk County with nearby schools including Delaney Elementary School, Charles E Roderick, and Mercymount Country Day School.
Ownership History
Date
Name
Owned For
Owner Type
Purchase Details
Closed on
Aug 29, 1996
Sold by
Ferran Tr Herbert G and Ferran Tr Beverley E
Bought by
Redman John F and Redman Kathleen K
Current Estimated Value
Home Financials for this Owner
Home Financials are based on the most recent Mortgage that was taken out on this home.
Original Mortgage
$168,000
Interest Rate
8.18%
Mortgage Type
Purchase Money Mortgage
Create a Home Valuation Report for This Property
The Home Valuation Report is an in-depth analysis detailing your home's value as well as a comparison with similar homes in the area
Home Values in the Area
Average Home Value in this Area
Purchase History
| Date | Buyer | Sale Price | Title Company |
|---|---|---|---|
| Redman John F | $210,000 | -- |
Source: Public Records
Mortgage History
| Date | Status | Borrower | Loan Amount |
|---|---|---|---|
| Open | Redman John F | $200,000 | |
| Closed | Redman John F | $164,600 | |
| Closed | Redman John F | $168,000 |
Source: Public Records
Tax History
| Year | Tax Paid | Tax Assessment Tax Assessment Total Assessment is a certain percentage of the fair market value that is determined by local assessors to be the total taxable value of land and additions on the property. | Land | Improvement |
|---|---|---|---|---|
| 2025 | $7,432 | $641,200 | $323,600 | $317,600 |
| 2024 | $7,283 | $606,900 | $323,600 | $283,300 |
| 2023 | $6,950 | $550,700 | $294,400 | $256,300 |
| 2022 | $6,205 | $453,900 | $234,700 | $219,200 |
| 2021 | $5,639 | $400,800 | $199,000 | $201,800 |
| 2020 | $5,220 | $366,300 | $164,900 | $201,400 |
| 2019 | $5,302 | $375,500 | $183,100 | $192,400 |
| 2018 | $5,445 | $382,400 | $182,900 | $199,500 |
| 2017 | $5,109 | $358,500 | $179,300 | $179,200 |
| 2016 | $4,998 | $350,000 | $174,200 | $175,800 |
| 2015 | $4,849 | $323,700 | $167,400 | $156,300 |
| 2014 | $4,772 | $311,700 | $161,000 | $150,700 |
Source: Public Records
Map
Nearby Homes
- 440 Chestnut St
- 613 West St
- 955 Summer St
- 20 Field Cir
- 1222 South St
- 0 Fall Ln
- 19 Chestnut Lot 0
- 11 Amber Dr
- Lot 1 - Blueberry 2 Car Plan at King Philip Estates
- Lot 8 - Blueberry 2 Car Plan at King Philip Estates
- Lot 5 - Hughes 2 car Plan at King Philip Estates
- Lot 6 - Blueberry 3 Car Plan at King Philip Estates
- 10 Earle Stewart Ln Unit Lot 5
- Lot 2 - Camden 2 Car Plan at King Philip Estates
- Lot 7 - Cedar Plan at King Philip Estates
- Lot 4 - Hemingway 2 Car Plan at King Philip Estates
- Lot 3 - Blueberry 2 Car Plan at King Philip Estates
- 12 Earle Stewart Ln
- 11 Earle Stewart Ln
- 18 Huntington Ave
Your Personal Tour Guide
Ask me questions while you tour the home.