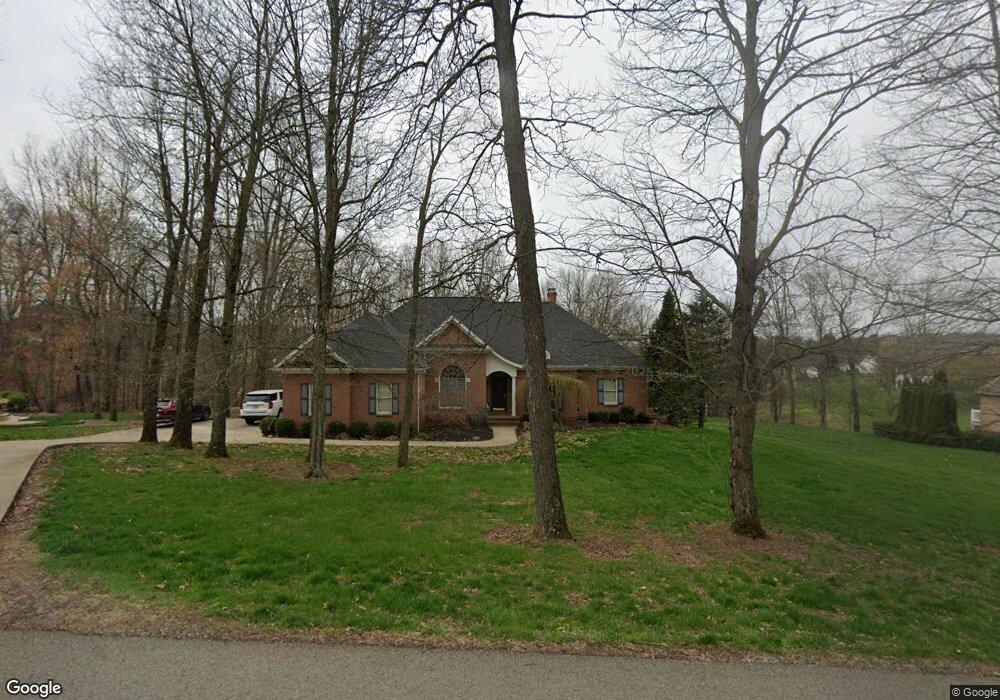
185 Cobble Pond Rd Zanesville, OH 43701
Estimated Value: $550,000 - $711,612
5
Beds
5
Baths
2,347
Sq Ft
$257/Sq Ft
Est. Value
About This Home
This home is located at 185 Cobble Pond Rd, Zanesville, OH 43701 and is currently estimated at $603,403, approximately $257 per square foot. 185 Cobble Pond Rd is a home located in Muskingum County with nearby schools including Perry Elementary School, East Muskingum Middle School, and Larry Miller Intermediate Elementary School.
Ownership History
Date
Name
Owned For
Owner Type
Purchase Details
Closed on
Apr 12, 2004
Sold by
Moore Kevin J and Moore Stephany K
Bought by
Moore Kevin J and Moore Stephany K
Current Estimated Value
Home Financials for this Owner
Home Financials are based on the most recent Mortgage that was taken out on this home.
Original Mortgage
$300,900
Outstanding Balance
$141,600
Interest Rate
5.66%
Mortgage Type
New Conventional
Estimated Equity
$461,803
Purchase Details
Closed on
Feb 13, 2002
Sold by
Summers Mary E
Bought by
Moore Kevin J and Moore Stephany K
Home Financials for this Owner
Home Financials are based on the most recent Mortgage that was taken out on this home.
Original Mortgage
$380,000
Interest Rate
6.3%
Mortgage Type
New Conventional
Purchase Details
Closed on
Feb 17, 1999
Sold by
Goff Carol
Bought by
Summers Mary E
Create a Home Valuation Report for This Property
The Home Valuation Report is an in-depth analysis detailing your home's value as well as a comparison with similar homes in the area
Home Values in the Area
Average Home Value in this Area
Purchase History
| Date | Buyer | Sale Price | Title Company |
|---|---|---|---|
| Moore Kevin J | -- | -- | |
| Moore Kevin J | $380,000 | -- | |
| Summers Mary E | $280,000 | -- |
Source: Public Records
Mortgage History
| Date | Status | Borrower | Loan Amount |
|---|---|---|---|
| Open | Moore Kevin J | $300,900 | |
| Closed | Moore Kevin J | $380,000 |
Source: Public Records
Tax History Compared to Growth
Tax History
| Year | Tax Paid | Tax Assessment Tax Assessment Total Assessment is a certain percentage of the fair market value that is determined by local assessors to be the total taxable value of land and additions on the property. | Land | Improvement |
|---|---|---|---|---|
| 2024 | $7,255 | $201,705 | $18,970 | $182,735 |
| 2023 | $6,807 | $173,215 | $19,250 | $153,965 |
| 2022 | $6,452 | $173,215 | $19,250 | $153,965 |
| 2021 | $6,379 | $173,215 | $19,250 | $153,965 |
| 2020 | $6,001 | $157,465 | $17,500 | $139,965 |
| 2019 | $5,972 | $157,465 | $17,500 | $139,965 |
| 2018 | $3,288 | $157,465 | $17,500 | $139,965 |
| 2017 | $4,739 | $128,275 | $17,500 | $110,775 |
| 2016 | $4,747 | $128,280 | $17,500 | $110,780 |
| 2015 | $4,865 | $128,280 | $17,500 | $110,780 |
| 2013 | $5,200 | $128,280 | $17,500 | $110,780 |
Source: Public Records
Map
Nearby Homes
- 6265 Canterbury Way Unit LOT 30
- 6600 Bridgeville Dr
- 310 Trappers Hollow Rd
- 400 Spring Valley Dr
- 7115 East Pike
- 350 Urban Hill Rd
- 1305 Bald Hill Rd
- 5180 Pine Valley Dr
- 130 Airport Rd
- 380 Urban Hill Rd
- 0 E Wheeling Rd Unit 5162172
- 4655 Boggs Rd
- 7915 East Pike
- 4460 East Pike
- 365 Walters Way
- 360 Walters Way
- 0 Sonora Rd Unit 225018643
- 0 Sonora Rd Unit 5125925
- 2125 Long Rd
- 0 Okey Rd Unit 5130633
- 165 Cobble Pond Rd
- 0 Cobble Pond Rd
- LOT #3 Cobblepond Rd
- 205 Cobble Pond Rd
- 190 Cobble Pond Rd
- 145 Cobble Pond Rd
- 295 Cobble Pond Rd
- 255 Cobble Pond Rd
- 275 Cobble Pond Rd
- 210 Cobble Pond Rd
- 148 Chelsea Cove
- 150 Cobble Pond Rd
- 0 Chelsea Cove
- 235 Cobble Pond Rd
- 173 Chelsea Cove
- 6205 Canterbury Way
- 300 Cobble Pond Rd
- 143 Chelsea Cove
- 163 Chelsea Cove
- 153 Chelsea Cove