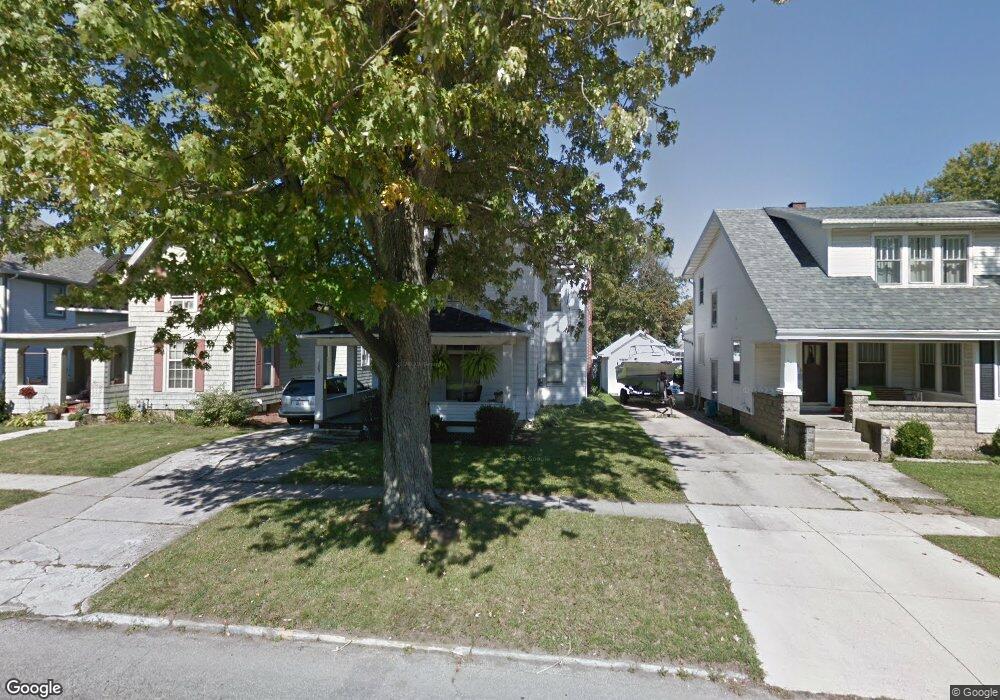
185 Coe St Tiffin, OH 44883
Estimated Value: $174,872 - $203,000
4
Beds
2
Baths
1,688
Sq Ft
$109/Sq Ft
Est. Value
About This Home
This home is located at 185 Coe St, Tiffin, OH 44883 and is currently estimated at $184,218, approximately $109 per square foot. 185 Coe St is a home located in Seneca County with nearby schools including Columbian High School, Bridges Community Academy, and Calvert High School.
Ownership History
Date
Name
Owned For
Owner Type
Purchase Details
Closed on
Apr 19, 2010
Sold by
Fisher Kimberly S
Bought by
Fisher Richard L
Current Estimated Value
Home Financials for this Owner
Home Financials are based on the most recent Mortgage that was taken out on this home.
Original Mortgage
$103,770
Outstanding Balance
$66,282
Interest Rate
4.5%
Mortgage Type
FHA
Estimated Equity
$117,936
Purchase Details
Closed on
Jun 17, 1997
Sold by
Felton John C
Bought by
Fisher Richard L
Purchase Details
Closed on
May 17, 1993
Sold by
Ceculski Rebekah E
Bought by
Felton John C
Purchase Details
Closed on
May 29, 1990
Purchase Details
Closed on
Feb 1, 1988
Create a Home Valuation Report for This Property
The Home Valuation Report is an in-depth analysis detailing your home's value as well as a comparison with similar homes in the area
Home Values in the Area
Average Home Value in this Area
Purchase History
| Date | Buyer | Sale Price | Title Company |
|---|---|---|---|
| Fisher Richard L | -- | None Available | |
| Fisher Richard L | $82,000 | -- | |
| Felton John C | $64,500 | -- | |
| -- | $57,900 | -- | |
| -- | $47,500 | -- |
Source: Public Records
Mortgage History
| Date | Status | Borrower | Loan Amount |
|---|---|---|---|
| Open | Fisher Richard L | $103,770 |
Source: Public Records
Tax History
| Year | Tax Paid | Tax Assessment Tax Assessment Total Assessment is a certain percentage of the fair market value that is determined by local assessors to be the total taxable value of land and additions on the property. | Land | Improvement |
|---|---|---|---|---|
| 2025 | $1,738 | $51,260 | $4,880 | $46,380 |
| 2024 | $1,730 | $51,260 | $4,880 | $46,380 |
| 2023 | $1,732 | $51,260 | $4,880 | $46,380 |
| 2022 | $1,825 | $44,830 | $4,590 | $40,240 |
| 2021 | $1,839 | $44,830 | $4,590 | $40,240 |
| 2020 | $1,874 | $44,825 | $4,589 | $40,236 |
| 2019 | $1,671 | $38,686 | $4,064 | $34,622 |
| 2018 | $1,674 | $38,686 | $4,064 | $34,622 |
| 2017 | $1,692 | $38,686 | $4,064 | $34,622 |
| 2016 | $1,518 | $35,561 | $3,903 | $31,658 |
| 2015 | $1,500 | $35,561 | $3,903 | $31,658 |
| 2014 | $1,413 | $35,561 | $3,903 | $31,658 |
| 2013 | $1,526 | $37,013 | $4,064 | $32,949 |
Source: Public Records
Map
Nearby Homes
Your Personal Tour Guide
Ask me questions while you tour the home.