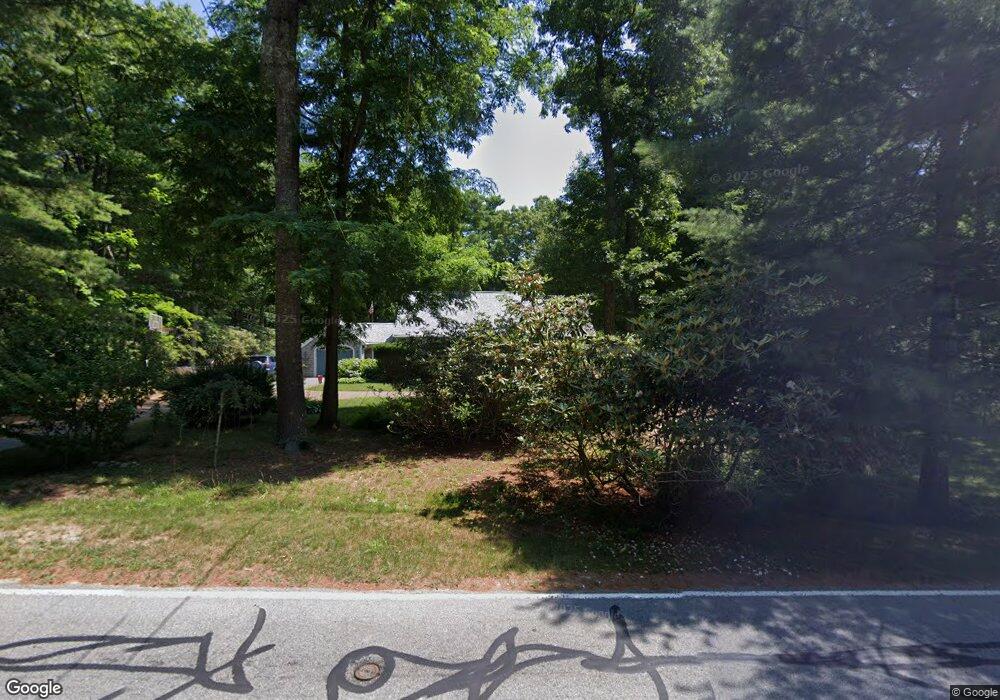
185 Converse Rd Marion, MA 02738
Marion Center NeighborhoodEstimated Value: $738,658 - $1,163,000
4
Beds
2
Baths
2,248
Sq Ft
$397/Sq Ft
Est. Value
About This Home
This home is located at 185 Converse Rd, Marion, MA 02738 and is currently estimated at $892,165, approximately $396 per square foot. 185 Converse Rd is a home located in Plymouth County with nearby schools including Old Rochester Regional High School and Tabor Academy.
Ownership History
Date
Name
Owned For
Owner Type
Purchase Details
Closed on
Aug 21, 2025
Sold by
Santello Gayle B
Bought by
Santello Peter A and Santello Gayle B
Current Estimated Value
Purchase Details
Closed on
Jun 30, 1998
Sold by
Leonard C Elyse
Bought by
Santello Gayle B
Home Financials for this Owner
Home Financials are based on the most recent Mortgage that was taken out on this home.
Original Mortgage
$274,000
Interest Rate
7.09%
Mortgage Type
Purchase Money Mortgage
Purchase Details
Closed on
Mar 1, 1993
Sold by
Chu Gregory and Chu Anne
Bought by
Leonard C Elyse
Home Financials for this Owner
Home Financials are based on the most recent Mortgage that was taken out on this home.
Original Mortgage
$100,000
Interest Rate
8.03%
Mortgage Type
Purchase Money Mortgage
Create a Home Valuation Report for This Property
The Home Valuation Report is an in-depth analysis detailing your home's value as well as a comparison with similar homes in the area
Home Values in the Area
Average Home Value in this Area
Purchase History
| Date | Buyer | Sale Price | Title Company |
|---|---|---|---|
| Santello Peter A | -- | -- | |
| Santello Peter A | -- | -- | |
| Santello Gayle B | $275,000 | -- | |
| Santello Gayle B | $275,000 | -- | |
| Leonard C Elyse | $200,000 | -- | |
| Leonard C Elyse | $200,000 | -- |
Source: Public Records
Mortgage History
| Date | Status | Borrower | Loan Amount |
|---|---|---|---|
| Previous Owner | Leonard C Elyse | $274,000 | |
| Previous Owner | Leonard C Elyse | $100,000 |
Source: Public Records
Tax History
| Year | Tax Paid | Tax Assessment Tax Assessment Total Assessment is a certain percentage of the fair market value that is determined by local assessors to be the total taxable value of land and additions on the property. | Land | Improvement |
|---|---|---|---|---|
| 2025 | $5,476 | $587,600 | $264,700 | $322,900 |
| 2024 | $5,347 | $577,400 | $264,700 | $312,700 |
| 2023 | $4,902 | $519,300 | $234,800 | $284,500 |
| 2022 | $4,923 | $453,700 | $177,100 | $276,600 |
| 2021 | $4,928 | $435,300 | $159,400 | $275,900 |
| 2020 | $5,141 | $439,400 | $177,100 | $262,300 |
| 2019 | $4,847 | $439,400 | $177,100 | $262,300 |
| 2018 | $4,599 | $401,700 | $178,700 | $223,000 |
| 2017 | $4,458 | $390,700 | $178,700 | $212,000 |
| 2016 | $4,419 | $390,700 | $178,700 | $212,000 |
| 2015 | $4,491 | $404,200 | $170,200 | $234,000 |
Source: Public Records
Map
Nearby Homes
Your Personal Tour Guide
Ask me questions while you tour the home.