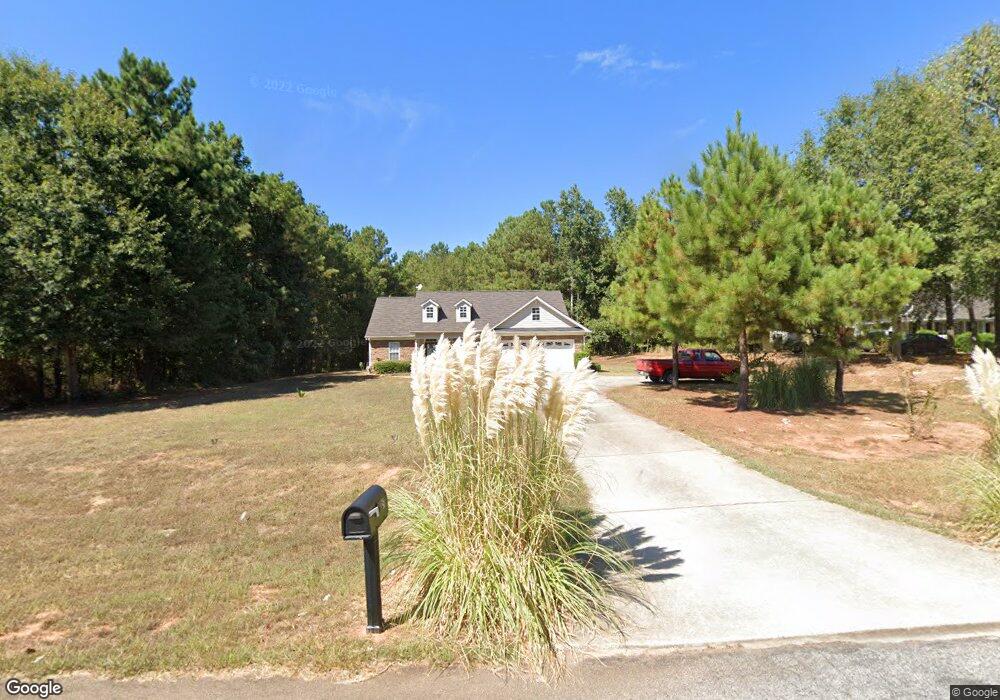
185 Deerfield Trace Barnesville, GA 30204
Estimated Value: $249,289 - $310,000
3
Beds
2
Baths
1,430
Sq Ft
$194/Sq Ft
Est. Value
About This Home
This home is located at 185 Deerfield Trace, Barnesville, GA 30204 and is currently estimated at $277,072, approximately $193 per square foot. 185 Deerfield Trace is a home located in Lamar County with nearby schools including Lamar County Primary School, Lamar County Elementary School, and Lamar County Middle School.
Ownership History
Date
Name
Owned For
Owner Type
Purchase Details
Closed on
Sep 15, 2016
Sold by
Hileman Scott W and Hileman Melvin J
Bought by
Smith Travis
Current Estimated Value
Home Financials for this Owner
Home Financials are based on the most recent Mortgage that was taken out on this home.
Original Mortgage
$121,000
Outstanding Balance
$96,125
Interest Rate
3.43%
Mortgage Type
VA
Estimated Equity
$180,947
Purchase Details
Closed on
Aug 18, 2006
Sold by
Clements Melinda A
Bought by
Hileman Scott W
Home Financials for this Owner
Home Financials are based on the most recent Mortgage that was taken out on this home.
Original Mortgage
$100,800
Interest Rate
6.73%
Mortgage Type
New Conventional
Purchase Details
Closed on
Oct 30, 2003
Sold by
Pilkenton Dickie
Bought by
Clements Melinda and Clements Phillip
Purchase Details
Closed on
Jun 24, 2002
Sold by
Pilkenton-Bankston
Bought by
Pilkenton Dickie
Create a Home Valuation Report for This Property
The Home Valuation Report is an in-depth analysis detailing your home's value as well as a comparison with similar homes in the area
Purchase History
| Date | Buyer | Sale Price | Title Company |
|---|---|---|---|
| Smith Travis | $121,000 | -- | |
| Hileman Scott W | $126,000 | -- | |
| Clements Melinda | $123,000 | -- | |
| Pilkenton Dickie | $20,000 | -- |
Source: Public Records
Mortgage History
| Date | Status | Borrower | Loan Amount |
|---|---|---|---|
| Open | Smith Travis | $121,000 | |
| Previous Owner | Hileman Scott W | $100,800 | |
| Previous Owner | Hileman Scott W | $25,200 |
Source: Public Records
Tax History
| Year | Tax Paid | Tax Assessment Tax Assessment Total Assessment is a certain percentage of the fair market value that is determined by local assessors to be the total taxable value of land and additions on the property. | Land | Improvement |
|---|---|---|---|---|
| 2025 | $2,109 | $95,694 | $8,200 | $87,494 |
| 2024 | $1,977 | $79,130 | $8,200 | $70,930 |
| 2023 | $2,062 | $76,596 | $8,200 | $68,396 |
| 2022 | $1,876 | $69,857 | $8,200 | $61,657 |
| 2021 | $1,529 | $52,741 | $4,400 | $48,341 |
| 2020 | $1,524 | $50,052 | $4,400 | $45,652 |
| 2019 | $1,216 | $40,218 | $4,400 | $35,818 |
| 2018 | $1,168 | $40,218 | $4,400 | $35,818 |
| 2017 | $1,161 | $40,218 | $4,400 | $35,818 |
| 2016 | $1,219 | $40,218 | $4,400 | $35,818 |
| 2015 | $1,154 | $38,116 | $4,400 | $33,716 |
| 2014 | $1,119 | $38,116 | $4,400 | $33,716 |
| 2013 | -- | $38,115 | $4,400 | $33,715 |
Source: Public Records
Map
Nearby Homes
- 113 Heatherwood Ln
- 233 Old 41 Hwy
- 634 Grove St
- 0 Silver Dollar Rd Unit 10552561
- 0 Main St Unit 10711218
- 0 Roger Brown Dr Unit 10702547
- 0 Piedmont Rd Unit 10600733
- 140 Catalpa Rd
- 135 Catalpa Rd
- 114 Catalpa Rd
- 141 Dogwood Ln
- 587 Highway 41 N
- 146 Maple Dr
- 124 Dogwood Ln
- V L Silver Dollar Rd
- 163 Grove St
- 134 Belleflower Way
- 178 Barnesville Ave
- 225 Cole Forest Blvd
- 121 Westchester Dr
- 191 Deerfield Trace
- 177 Deerfield Trace
- 193 Deerfield Trace
- 186 Deerfield Trace
- 182 Deerfield Trace
- 178 Deerfield Trace
- 169 Deerfield Trace
- 190 Deerfield Trace
- 195 Deerfield Trace
- 174 Deerfield Trace
- 194 Deerfield Trace
- 170 Deerfield Trace
- 161 Deerfield Trace
- 164 Deerfield Trace
- 155 Deerfield Trace
- 134 Heatherwood Ln
- 149 Deerfield Trace
- 160 Deerfield Trace Unit 26
- 160 Deerfield Trace
- 156 Deerfield Trace
Your Personal Tour Guide
Ask me questions while you tour the home.