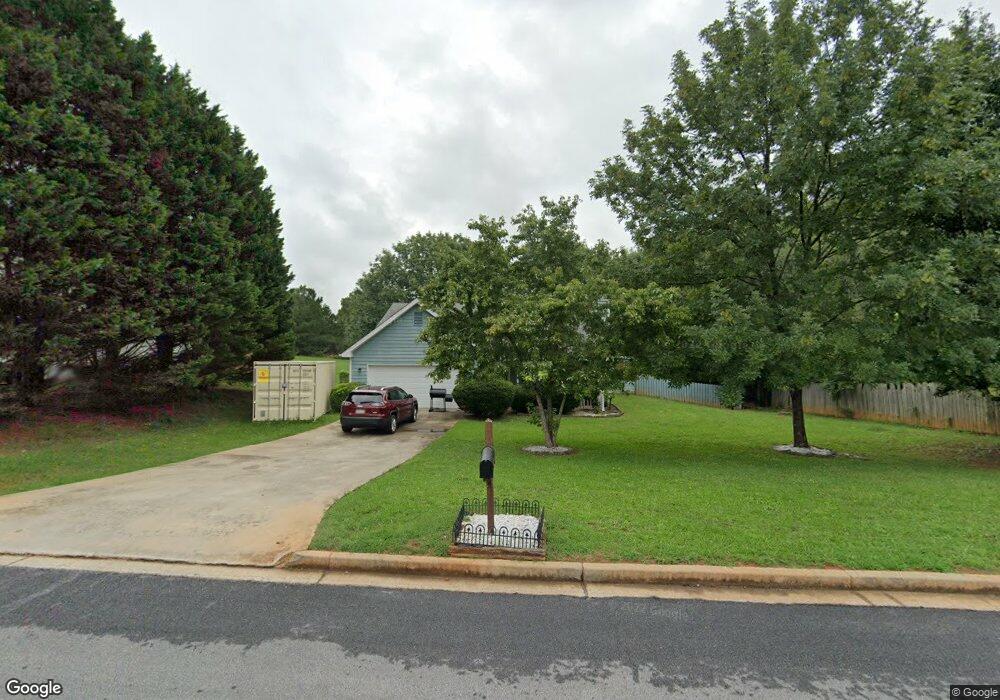
185 Dove Point Unit 42B Covington, GA 30016
Estimated Value: $242,856 - $273,000
3
Beds
2
Baths
1,359
Sq Ft
$189/Sq Ft
Est. Value
About This Home
This home is located at 185 Dove Point Unit 42B, Covington, GA 30016 and is currently estimated at $256,964, approximately $189 per square foot. 185 Dove Point Unit 42B is a home located in Newton County with nearby schools including South Salem Elementary School, Liberty Middle School, and Alcovy High School.
Ownership History
Date
Name
Owned For
Owner Type
Purchase Details
Closed on
Jun 11, 2018
Sold by
Edwards Ida B
Bought by
Edwards Ida B and Edwards Harvey G
Current Estimated Value
Home Financials for this Owner
Home Financials are based on the most recent Mortgage that was taken out on this home.
Original Mortgage
$129,609
Outstanding Balance
$112,090
Interest Rate
4.5%
Mortgage Type
FHA
Estimated Equity
$144,874
Purchase Details
Closed on
May 2, 2002
Sold by
Isham Clayton S and Isham Julie A
Bought by
Studdard Billy J and Studdard Elizabeth
Home Financials for this Owner
Home Financials are based on the most recent Mortgage that was taken out on this home.
Original Mortgage
$60,000
Interest Rate
6.98%
Mortgage Type
New Conventional
Purchase Details
Closed on
Sep 11, 1996
Sold by
Davis Jerry L and Middlebrooks Roy J
Bought by
Isham Clayton S Julie A
Create a Home Valuation Report for This Property
The Home Valuation Report is an in-depth analysis detailing your home's value as well as a comparison with similar homes in the area
Home Values in the Area
Average Home Value in this Area
Purchase History
| Date | Buyer | Sale Price | Title Company |
|---|---|---|---|
| Edwards Ida B | -- | -- | |
| Edwards Ida B | $132,000 | -- | |
| Studdard Billy J | $105,000 | -- | |
| Isham Clayton S Julie A | $82,900 | -- |
Source: Public Records
Mortgage History
| Date | Status | Borrower | Loan Amount |
|---|---|---|---|
| Open | Edwards Ida B | $129,609 | |
| Closed | Edwards Ida B | $129,609 | |
| Previous Owner | Studdard Billy J | $60,000 | |
| Closed | Isham Clayton S Julie A | $0 |
Source: Public Records
Tax History Compared to Growth
Tax History
| Year | Tax Paid | Tax Assessment Tax Assessment Total Assessment is a certain percentage of the fair market value that is determined by local assessors to be the total taxable value of land and additions on the property. | Land | Improvement |
|---|---|---|---|---|
| 2024 | $1,476 | $98,800 | $15,200 | $83,600 |
| 2023 | $1,912 | $98,480 | $8,800 | $89,680 |
| 2022 | $1,443 | $81,200 | $8,800 | $72,400 |
| 2021 | $982 | $60,600 | $8,800 | $51,800 |
| 2020 | $843 | $53,520 | $7,200 | $46,320 |
| 2019 | $641 | $47,240 | $7,200 | $40,040 |
| 2018 | $1,518 | $43,440 | $7,200 | $36,240 |
| 2017 | $1,113 | $35,560 | $5,600 | $29,960 |
| 2016 | $749 | $24,960 | $3,800 | $21,160 |
| 2015 | $656 | $22,240 | $3,200 | $19,040 |
| 2014 | $655 | $22,240 | $0 | $0 |
Source: Public Records
Map
Nearby Homes
- 115 Branchwood Dr
- 255 Countryside Ln
- 472 Oak Hill Rd
- 205 Woodcrest Dr
- 70 Countryside Ln
- 145 Whispering Pine Dr
- 135 Woodcrest Dr
- 30 Oak Wood Ln
- 25 Woodcrest Dr
- 40 Lakeside Trail
- 265 Lazy Hollow Ln
- 800 Mills Dr
- 40 Belmont Cir Unit 2
- 75 Oak Hill Dr
- 70 Cowan Ridge
- 230 Belmont Trail
- 930 Smith Store Rd
- 245 Belmont Trail
- 115 Cross Creek Dr
- 185 Dove Point Unit 4
- 195 Dove Point Unit 4
- 180 Dove Point
- 165 Dove Point
- 190 Dove Point
- 300 Branchwood Dr Unit 4
- 160 Dove Point Unit 4
- 170 Dove Point Unit 4
- 155 Dove Point
- 290 Branchwood Dr Unit 4
- 90 Dove Point Cir
- 340 Branchwood Dr Unit 4
- 150 Dove Point Unit 4
- 80 Dove Point Cir Unit 3
- 280 Branchwood Dr Unit 4
- 10 Dove Landing
- 20 Dove Landing Unit 3
- 335 Branchwood Dr
- 105 Dove Point Cir Unit 3
- 315 Branchwood Dr