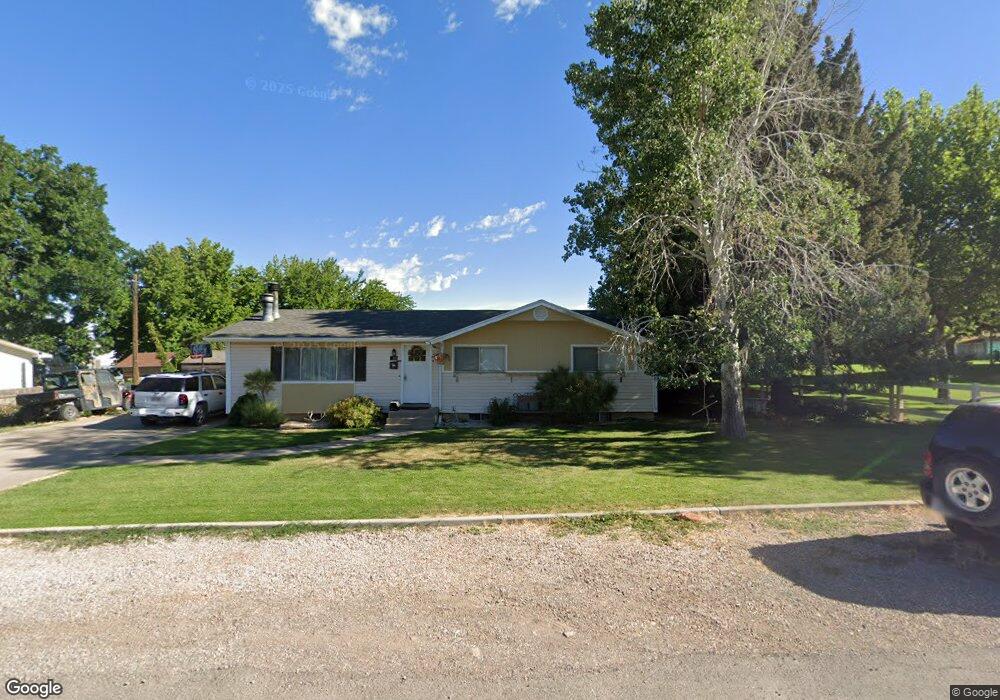
185 E Center St Fillmore, UT 84631
Estimated Value: $318,064 - $344,000
4
Beds
2
Baths
2,496
Sq Ft
$132/Sq Ft
Est. Value
About This Home
This home is located at 185 E Center St, Fillmore, UT 84631 and is currently estimated at $329,016, approximately $131 per square foot. 185 E Center St is a home located in Millard County.
Ownership History
Date
Name
Owned For
Owner Type
Purchase Details
Closed on
Jul 30, 2012
Sold by
Wright Kenneth Darwin
Bought by
Wright Kenneth Darwin and Wright Bethany
Current Estimated Value
Home Financials for this Owner
Home Financials are based on the most recent Mortgage that was taken out on this home.
Original Mortgage
$111,198
Outstanding Balance
$76,410
Interest Rate
3.65%
Mortgage Type
FHA
Estimated Equity
$252,606
Purchase Details
Closed on
Jul 23, 2012
Sold by
Wells Fargo Bank Wells Fargo Bank N and Wells Fargo Bank A
Bought by
Wright Kenneth Darwin
Home Financials for this Owner
Home Financials are based on the most recent Mortgage that was taken out on this home.
Original Mortgage
$111,198
Outstanding Balance
$76,410
Interest Rate
3.65%
Mortgage Type
FHA
Estimated Equity
$252,606
Purchase Details
Closed on
Jan 24, 2008
Sold by
Starley Dianna Kae
Bought by
Larsen Lynn L and Larsen Kristina B
Home Financials for this Owner
Home Financials are based on the most recent Mortgage that was taken out on this home.
Original Mortgage
$149,940
Interest Rate
6.09%
Mortgage Type
Purchase Money Mortgage
Create a Home Valuation Report for This Property
The Home Valuation Report is an in-depth analysis detailing your home's value as well as a comparison with similar homes in the area
Home Values in the Area
Average Home Value in this Area
Purchase History
We collect this data history from publicly available records. To have your information removed, we recommend requesting removal directly through your county’s website.
| Date | Buyer | Sale Price | Title Company |
|---|---|---|---|
| Wright Kenneth Darwin | -- | First American Title Insuran | |
| Wright Kenneth Darwin | -- | First American Title Insuran | |
| Larsen Lynn L | -- | -- |
Source: Public Records
Mortgage History
We collect this data history from publicly available records. To have your information removed, we recommend requesting removal directly through your county’s website.
| Date | Status | Borrower | Loan Amount |
|---|---|---|---|
| Open | Wright Kenneth Darwin | $111,198 | |
| Closed | Wright Kenneth Darwin | $111,198 | |
| Previous Owner | Larsen Lynn L | $149,940 |
Source: Public Records
Tax History
| Year | Tax Paid | Tax Assessment Tax Assessment Total Assessment is a certain percentage of the fair market value that is determined by local assessors to be the total taxable value of land and additions on the property. | Land | Improvement |
|---|---|---|---|---|
| 2025 | $1,240 | $155,789 | $24,969 | $130,820 |
| 2024 | $1,240 | $151,391 | $31,763 | $119,628 |
| 2023 | $1,561 | $151,391 | $31,763 | $119,628 |
| 2022 | $1,143 | $102,604 | $22,688 | $79,916 |
| 2021 | $1,027 | $88,540 | $18,150 | $70,390 |
| 2020 | $947 | $82,100 | $16,500 | $65,600 |
| 2019 | $818 | $71,144 | $16,500 | $54,644 |
| 2018 | $780 | $69,424 | $16,500 | $52,924 |
| 2017 | $727 | $61,507 | $16,500 | $45,007 |
| 2016 | $695 | $61,507 | $16,500 | $45,007 |
| 2015 | $695 | $61,507 | $16,500 | $45,007 |
| 2014 | -- | $61,507 | $16,500 | $45,007 |
| 2013 | -- | $61,507 | $16,500 | $45,007 |
Source: Public Records
Map
Nearby Homes
Your Personal Tour Guide
Ask me questions while you tour the home.