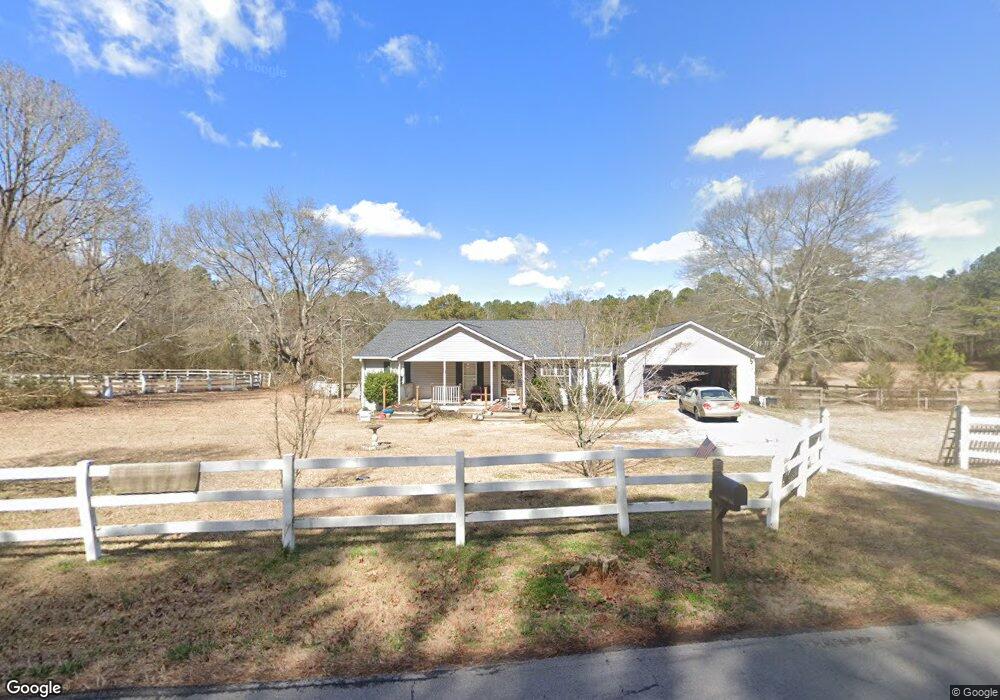
185 E Davis Bridge Rd Villa Rica, GA 30180
Abilene NeighborhoodEstimated Value: $440,548 - $557,000
3
Beds
3
Baths
2,426
Sq Ft
$202/Sq Ft
Est. Value
About This Home
This home is located at 185 E Davis Bridge Rd, Villa Rica, GA 30180 and is currently estimated at $489,637, approximately $201 per square foot. 185 E Davis Bridge Rd is a home located in Carroll County with nearby schools including Ithica Elementary School, Bay Springs Middle School, and Villa Rica High School.
Ownership History
Date
Name
Owned For
Owner Type
Purchase Details
Closed on
Oct 8, 2007
Sold by
Not Provided
Bought by
Fields Floyd D
Current Estimated Value
Purchase Details
Closed on
May 28, 2007
Sold by
Not Provided
Bought by
Fields Floyd D
Purchase Details
Closed on
May 25, 2005
Sold by
Peace Melissa G
Bought by
Fields Floyd D and Fields Vickie L
Home Financials for this Owner
Home Financials are based on the most recent Mortgage that was taken out on this home.
Original Mortgage
$155,000
Interest Rate
5.69%
Mortgage Type
New Conventional
Purchase Details
Closed on
Apr 30, 2004
Sold by
Thomas Karen J
Bought by
Peace Melissa G
Purchase Details
Closed on
Jun 1, 2000
Sold by
Johnson Karen D
Bought by
Thomas Karen J
Purchase Details
Closed on
Apr 29, 1994
Bought by
Johnson Karen D
Create a Home Valuation Report for This Property
The Home Valuation Report is an in-depth analysis detailing your home's value as well as a comparison with similar homes in the area
Home Values in the Area
Average Home Value in this Area
Purchase History
| Date | Buyer | Sale Price | Title Company |
|---|---|---|---|
| Fields Floyd D | -- | -- | |
| Fields Floyd D | -- | -- | |
| Fields Floyd D | $285,000 | -- | |
| Peace Melissa G | $229,700 | -- | |
| Thomas Karen J | $1,000 | -- | |
| Johnson Karen D | $79,000 | -- |
Source: Public Records
Mortgage History
| Date | Status | Borrower | Loan Amount |
|---|---|---|---|
| Previous Owner | Fields Floyd D | $155,000 |
Source: Public Records
Tax History Compared to Growth
Tax History
| Year | Tax Paid | Tax Assessment Tax Assessment Total Assessment is a certain percentage of the fair market value that is determined by local assessors to be the total taxable value of land and additions on the property. | Land | Improvement |
|---|---|---|---|---|
| 2024 | $405 | $156,568 | $37,536 | $119,032 |
| 2023 | $405 | $139,199 | $30,029 | $109,170 |
| 2022 | $482 | $107,691 | $20,019 | $87,672 |
| 2021 | $486 | $92,406 | $16,016 | $76,390 |
| 2020 | $488 | $81,556 | $14,560 | $66,996 |
| 2019 | $501 | $76,895 | $14,560 | $62,335 |
| 2018 | $511 | $69,895 | $11,833 | $58,062 |
| 2017 | $516 | $69,895 | $11,833 | $58,062 |
| 2016 | $439 | $69,895 | $11,833 | $58,062 |
| 2015 | $433 | $70,662 | $13,732 | $56,930 |
| 2014 | $436 | $70,663 | $13,732 | $56,930 |
Source: Public Records
Map
Nearby Homes
- 240 River Oak Ct
- 566 Clinton Dr
- 396 Lakeridge Dr
- 528 Clinton Dr
- 1509 Pleasant Grove Church Rd
- 128 W Lakeview Dr
- 0 Pleasant Oak Dr Unit 10610473
- 0 Pleasant Oak Dr Unit 148244
- 408 Reagan Dr
- 390 Bar J Rd
- 98 W Lakeview Dr
- 0 Bar J Rd Unit 10578558
- 0 Bar J Rd Unit 7627694
- 188 Lost Lake Trail
- 122 Blackstock Rd
- 1687 NE Hickory Level Rd
- 1100 Pleasant Grove Church Rd
- 127 Autumn Run Place
- 108 Villa Rosa Ridge
- 643 Windy Mill Way
- 188 E Davis Bridge Rd
- 141 E Davis Bridge Rd
- E E Davis Bridge Rd Unit 1
- E E Davis Bridge Rd
- 280 E Davis Bridge Rd
- 103 E Davis Bridge Rd
- 103 E Davis Bridge Rd
- 96 E Davis Bridge Rd
- 0 E Davis Bridge Rd Unit 7170864
- 300 E Davis Bridge Rd
- 291 E Davis Bridge Rd
- 89 E Davis Bridge Rd
- 2401 Pleasant Grove Church Rd
- 81 E Davis Bridge Rd
- 295 E Davis Bridge Rd
- 76 E Davis Bridge Rd 0 Unit 1
- 65 E Davis Bridge Rd
- 76 Davis
- 40 E Davis Bridge Rd
- 301 E Davis Bridge Rd