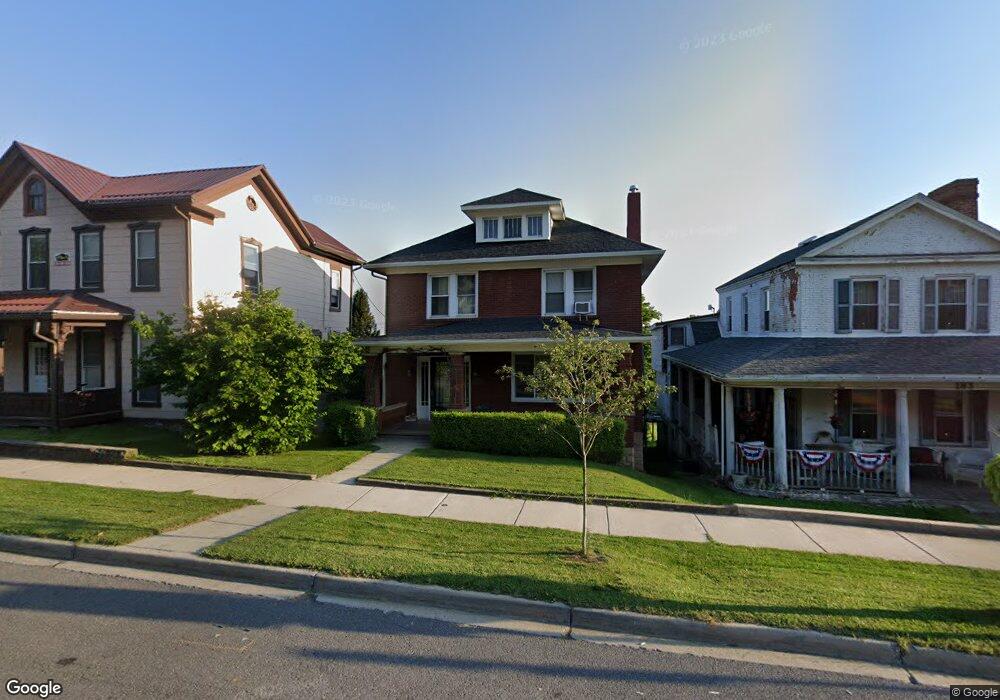
185 E Main St Frostburg, MD 21532
Estimated Value: $142,000 - $169,705
3
Beds
2
Baths
1,512
Sq Ft
$103/Sq Ft
Est. Value
About This Home
This home is located at 185 E Main St, Frostburg, MD 21532 and is currently estimated at $155,176, approximately $102 per square foot. 185 E Main St is a home located in Allegany County with nearby schools including Beall Elementary School, Mount Savage Middle School, and Mountain Ridge High School.
Ownership History
Date
Name
Owned For
Owner Type
Purchase Details
Closed on
Nov 17, 2009
Sold by
Shaw Brian A and Shaw Jennifer A
Bought by
Bond Charles W
Current Estimated Value
Purchase Details
Closed on
Apr 19, 2005
Sold by
Flick Richard M and Flick Elaine M
Bought by
Shaw Brian
Home Financials for this Owner
Home Financials are based on the most recent Mortgage that was taken out on this home.
Original Mortgage
$88,500
Interest Rate
5.87%
Mortgage Type
New Conventional
Create a Home Valuation Report for This Property
The Home Valuation Report is an in-depth analysis detailing your home's value as well as a comparison with similar homes in the area
Home Values in the Area
Average Home Value in this Area
Purchase History
| Date | Buyer | Sale Price | Title Company |
|---|---|---|---|
| Bond Charles W | $127,000 | -- | |
| Shaw Brian | $88,500 | -- |
Source: Public Records
Mortgage History
| Date | Status | Borrower | Loan Amount |
|---|---|---|---|
| Previous Owner | Shaw Brian | $88,500 | |
| Closed | Bond Charles W | -- |
Source: Public Records
Tax History Compared to Growth
Tax History
| Year | Tax Paid | Tax Assessment Tax Assessment Total Assessment is a certain percentage of the fair market value that is determined by local assessors to be the total taxable value of land and additions on the property. | Land | Improvement |
|---|---|---|---|---|
| 2025 | $1,452 | $142,800 | $14,200 | $128,600 |
| 2024 | $1,374 | $133,167 | $0 | $0 |
| 2023 | $1,248 | $123,533 | $0 | $0 |
| 2022 | $1,152 | $113,900 | $14,200 | $99,700 |
| 2021 | $1,135 | $111,533 | $0 | $0 |
| 2020 | $1,071 | $109,167 | $0 | $0 |
| 2019 | $1,057 | $106,800 | $14,200 | $92,600 |
| 2018 | $1,072 | $106,800 | $14,200 | $92,600 |
| 2017 | $1,062 | $106,800 | $0 | $0 |
| 2016 | $532 | $109,500 | $0 | $0 |
| 2015 | $1,065 | $109,133 | $0 | $0 |
| 2014 | $1,065 | $108,767 | $0 | $0 |
Source: Public Records
Map
Nearby Homes