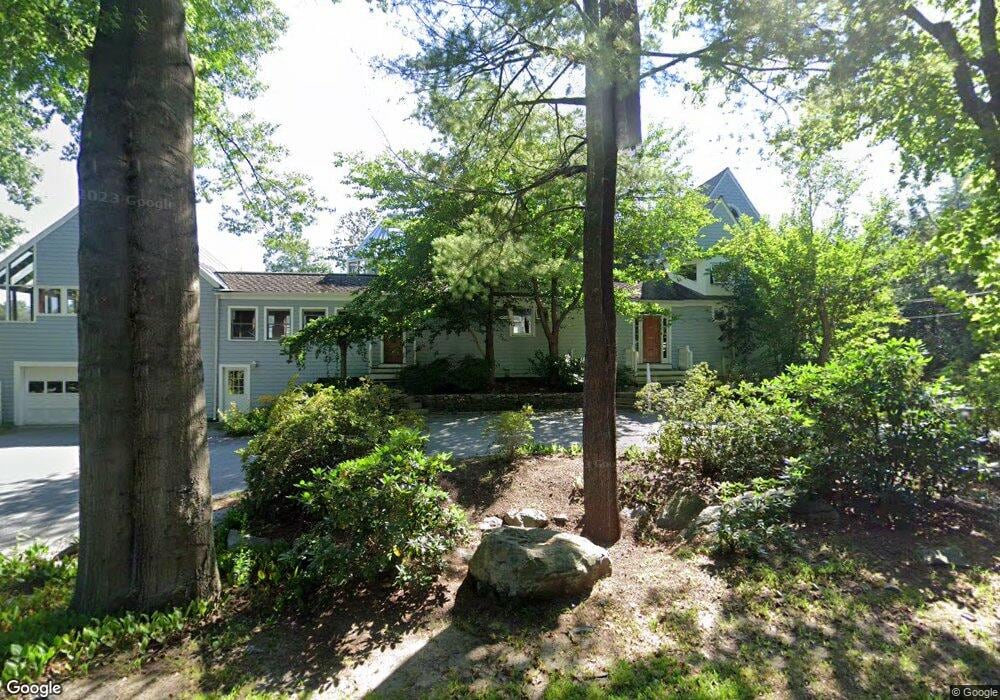
185 Elm St Concord, MA 01742
Estimated Value: $2,660,000 - $3,152,000
4
Beds
4
Baths
5,190
Sq Ft
$551/Sq Ft
Est. Value
About This Home
This home is located at 185 Elm St, Concord, MA 01742 and is currently estimated at $2,859,777, approximately $551 per square foot. 185 Elm St is a home located in Middlesex County with nearby schools including Willard School, Concord Middle School, and Concord Carlisle High School.
Ownership History
Date
Name
Owned For
Owner Type
Purchase Details
Closed on
May 30, 2013
Sold by
Kelman Steven J and Metzenbaum Shelley
Bought by
Hope Rt and Metzenbaum Shelley
Current Estimated Value
Purchase Details
Closed on
Oct 23, 1997
Sold by
185 Elm St T and Sunamura Yasuhide
Bought by
Kelman Steven J and Metzenbaum Shelley
Home Financials for this Owner
Home Financials are based on the most recent Mortgage that was taken out on this home.
Original Mortgage
$730,000
Interest Rate
7.48%
Mortgage Type
Purchase Money Mortgage
Purchase Details
Closed on
Sep 8, 1993
Sold by
Dull Michael and Livingston Kathryn D
Bought by
Lee T and Morgan Susan C
Create a Home Valuation Report for This Property
The Home Valuation Report is an in-depth analysis detailing your home's value as well as a comparison with similar homes in the area
Home Values in the Area
Average Home Value in this Area
Purchase History
| Date | Buyer | Sale Price | Title Company |
|---|---|---|---|
| Hope Rt | -- | -- | |
| Kelman Steven J | $930,000 | -- | |
| Lee T | $660,000 | -- |
Source: Public Records
Mortgage History
| Date | Status | Borrower | Loan Amount |
|---|---|---|---|
| Previous Owner | Lee T | $730,000 |
Source: Public Records
Tax History
| Year | Tax Paid | Tax Assessment Tax Assessment Total Assessment is a certain percentage of the fair market value that is determined by local assessors to be the total taxable value of land and additions on the property. | Land | Improvement |
|---|---|---|---|---|
| 2025 | $358 | $2,701,400 | $1,266,400 | $1,435,000 |
| 2024 | $34,692 | $2,642,200 | $1,266,400 | $1,375,800 |
| 2023 | $30,777 | $2,374,800 | $1,036,100 | $1,338,700 |
| 2022 | $29,014 | $1,965,700 | $828,700 | $1,137,000 |
| 2021 | $27,724 | $1,883,400 | $828,700 | $1,054,700 |
| 2020 | $28,043 | $1,970,700 | $828,700 | $1,142,000 |
| 2019 | $26,731 | $1,883,800 | $864,500 | $1,019,300 |
| 2018 | $24,970 | $1,747,400 | $766,400 | $981,000 |
| 2017 | $24,662 | $1,752,800 | $702,800 | $1,050,000 |
| 2016 | $23,583 | $1,694,200 | $702,800 | $991,400 |
| 2015 | $22,210 | $1,554,200 | $650,700 | $903,500 |
Source: Public Records
Map
Nearby Homes
- 106 Elm St
- 49 Willard Common
- 315 Musketaquid Rd
- 265 Elsinore St
- 29 Willard Common
- 22 Belknap Ct
- 244 Musterfield Rd
- 32 Thoreau St Unit 32
- 34 Thoreau St Unit 34
- 1 Baker Ave
- 101 Adams Rd
- 46 Sudbury Rd
- 150 Hubbard St Unit B
- 55 Staffordshire Ln Unit B
- 16 Concord Greene Unit 5
- 21 Concord Greene Unit 8
- 165 Everett St
- 143 Everett St
- 181 Stow St
- 47 Bridgecourt Ln
Your Personal Tour Guide
Ask me questions while you tour the home.