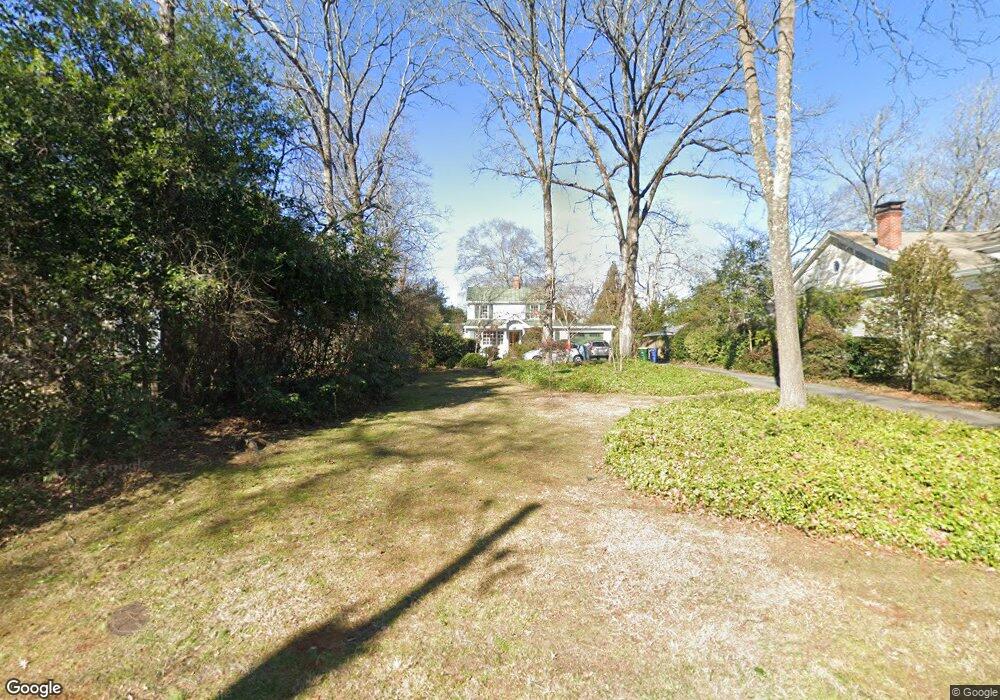
185 Hampton Ct Athens, GA 30605
Five Points NeighborhoodEstimated Value: $873,000 - $1,031,000
3
Beds
3
Baths
1,537
Sq Ft
$613/Sq Ft
Est. Value
About This Home
This home is located at 185 Hampton Ct, Athens, GA 30605 and is currently estimated at $941,450, approximately $612 per square foot. 185 Hampton Ct is a home located in Clarke County with nearby schools including Barrow Elementary School, Clarke Middle School, and Clarke Central High School.
Ownership History
Date
Name
Owned For
Owner Type
Purchase Details
Closed on
Sep 22, 2010
Sold by
Schmitt Sarah
Bought by
Belville Scott R
Current Estimated Value
Purchase Details
Closed on
Mar 25, 2003
Sold by
Bradford William W
Bought by
Schmitt Sarah Jane
Purchase Details
Closed on
Aug 3, 2001
Sold by
Frierson Joseph C and Frierson Lisa M
Bought by
Bradford William W
Purchase Details
Closed on
Aug 6, 1998
Sold by
Frierson Joseph C
Bought by
Frierson Joseph C and Frie Lisa M
Purchase Details
Closed on
May 5, 1995
Sold by
Mosevich Jack W Rita K Mosevich
Bought by
Frierson Joseph C
Purchase Details
Closed on
May 28, 1993
Sold by
Coggins Angela B
Bought by
Mosevich Jack W Rita K Mosevich
Purchase Details
Closed on
Jul 3, 1989
Sold by
Craig Christine E
Bought by
Coggins Angela B
Create a Home Valuation Report for This Property
The Home Valuation Report is an in-depth analysis detailing your home's value as well as a comparison with similar homes in the area
Home Values in the Area
Average Home Value in this Area
Purchase History
| Date | Buyer | Sale Price | Title Company |
|---|---|---|---|
| Belville Scott R | $325,000 | -- | |
| Schmitt Sarah Jane | -- | -- | |
| Bradford William W | $215,000 | -- | |
| Frierson Joseph C | $115,000 | -- | |
| Frierson Joseph C | $86,900 | -- | |
| Mosevich Jack W Rita K Mosevich | $89,000 | -- | |
| Coggins Angela B | $85,900 | -- |
Source: Public Records
Tax History
| Year | Tax Paid | Tax Assessment Tax Assessment Total Assessment is a certain percentage of the fair market value that is determined by local assessors to be the total taxable value of land and additions on the property. | Land | Improvement |
|---|---|---|---|---|
| 2025 | $6,214 | $341,048 | $70,000 | $271,048 |
| 2024 | $6,214 | $306,223 | $70,000 | $236,223 |
| 2023 | $6,270 | $279,450 | $70,000 | $209,450 |
| 2022 | $5,600 | $226,124 | $60,000 | $166,124 |
| 2021 | $5,697 | $210,834 | $60,000 | $150,834 |
| 2020 | $5,675 | $209,229 | $60,000 | $149,229 |
| 2019 | $5,465 | $190,600 | $60,000 | $130,600 |
| 2018 | $5,099 | $164,366 | $54,000 | $110,366 |
| 2017 | $0 | $157,300 | $54,000 | $103,300 |
| 2016 | $4,434 | $140,598 | $54,000 | $86,598 |
| 2015 | $4,283 | $135,956 | $50,000 | $85,956 |
| 2014 | $3,899 | $124,496 | $44,000 | $80,496 |
Source: Public Records
Map
Nearby Homes
- 293 Southview Dr
- 183 Parkway Dr
- 170 Northview Dr Unit 5
- 230 Milledge Terrace
- 1697 S Milledge Ave
- 145 Riverdale Dr
- 1554 S Lumpkin St Unit 4
- 1554 S Lumpkin St Unit 6
- 1554 S Lumpkin St Unit 5
- 1554 S Lumpkin St Unit 1
- 1554 S Lumpkin St Unit 3
- 1554 S Lumpkin St Unit 7
- 1554 S Lumpkin St Unit 2
- 173 Westview Dr
- 301 Parkway Dr
- 760 E Campus Rd Unit 95
- 150 Gran Ellen Dr
- 115 Annes Ct
- 655 E Campus Rd Unit 33
- 655 E Campus Rd Unit 12
- 175 Hampton Ct
- 195 Hampton Ct
- 170 University Dr
- 1495 S Milledge Ave
- 190 University Dr
- 160 University Dr
- 1485 S Milledge Ave
- 215 Hampton Ct
- 180 Hampton Ct
- 196 Hampton Ct
- 150 University Dr
- 136 Hampton Ct
- 210 University Dr
- 140 University Dr
- 210 Hampton Ct
- 120 Hampton Ct
- 225 Hampton Ct
- 220 University Dr
- 220 Hampton Ct
- 130 University Dr
Your Personal Tour Guide
Ask me questions while you tour the home.