Estimated Value: $848,363 - $928,000
3
Beds
2
Baths
2,153
Sq Ft
$415/Sq Ft
Est. Value
About This Home
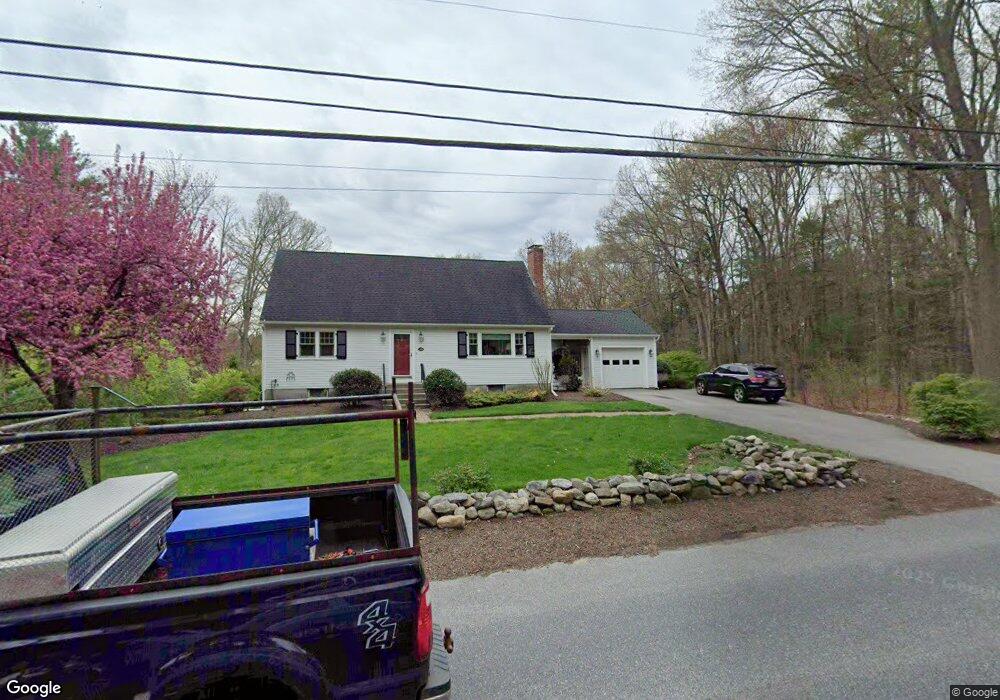
This home is located at 185 High St, Acton, MA 01720 and is currently estimated at $893,591, approximately $415 per square foot. 185 High St is a home located in Middlesex County with nearby schools including Acton-Boxborough Regional High School, Maynard Knowledge Beginnings, and The Imago School.
Ownership History
Date
Name
Owned For
Owner Type
Purchase Details
Closed on
Jul 16, 2003
Sold by
Kay Carolyn C and Kay William W
Bought by
Holloway Michelle and Holloway Michelle M
Current Estimated Value
Home Financials for this Owner
Home Financials are based on the most recent Mortgage that was taken out on this home.
Original Mortgage
$370,400
Outstanding Balance
$158,425
Interest Rate
5.34%
Mortgage Type
Purchase Money Mortgage
Estimated Equity
$735,166
Create a Home Valuation Report for This Property
The Home Valuation Report is an in-depth analysis detailing your home's value as well as a comparison with similar homes in the area
Home Values in the Area
Average Home Value in this Area
Purchase History
| Date | Buyer | Sale Price | Title Company |
|---|---|---|---|
| Holloway Michelle | $463,000 | -- |
Source: Public Records
Mortgage History
| Date | Status | Borrower | Loan Amount |
|---|---|---|---|
| Open | Holloway Michelle | $370,400 |
Source: Public Records
Tax History
| Year | Tax Paid | Tax Assessment Tax Assessment Total Assessment is a certain percentage of the fair market value that is determined by local assessors to be the total taxable value of land and additions on the property. | Land | Improvement |
|---|---|---|---|---|
| 2025 | $12,838 | $748,600 | $327,500 | $421,100 |
| 2024 | $12,122 | $727,200 | $327,500 | $399,700 |
| 2023 | $12,252 | $697,700 | $298,000 | $399,700 |
| 2022 | $11,061 | $568,700 | $258,700 | $310,000 |
| 2021 | $10,692 | $528,500 | $239,900 | $288,600 |
| 2020 | $10,028 | $521,200 | $239,900 | $281,300 |
| 2019 | $9,617 | $496,500 | $239,900 | $256,600 |
| 2018 | $9,452 | $487,700 | $239,900 | $247,800 |
| 2017 | $9,296 | $487,700 | $239,900 | $247,800 |
| 2016 | $8,832 | $459,300 | $239,900 | $219,400 |
| 2015 | $8,864 | $465,300 | $239,900 | $225,400 |
| 2014 | $8,655 | $445,000 | $239,900 | $205,100 |
Source: Public Records
Map
Nearby Homes
- 1 Drummer Rd Unit A5
- 128 Parker St Unit 3B
- 31 Drummer Rd Unit 31
- 30 Brewster Ln
- 63 Conant St
- 1 Vanderbelt Rd
- 40 High St
- 70 River St
- 7 Hillcrest Dr
- 36 Brown St
- 70 Powder Mill Rd
- 68 Powder Mill Rd
- 66 Powder Mill Rd
- 12 Brown St
- 96 Forest Ridge Rd Unit 96
- 23 Deer Path Unit 5
- 129 Main St Unit 129
- 131 Main St
- 25 Nylander Way
- 22 Douglas Ave Unit 2
Your Personal Tour Guide
Ask me questions while you tour the home.