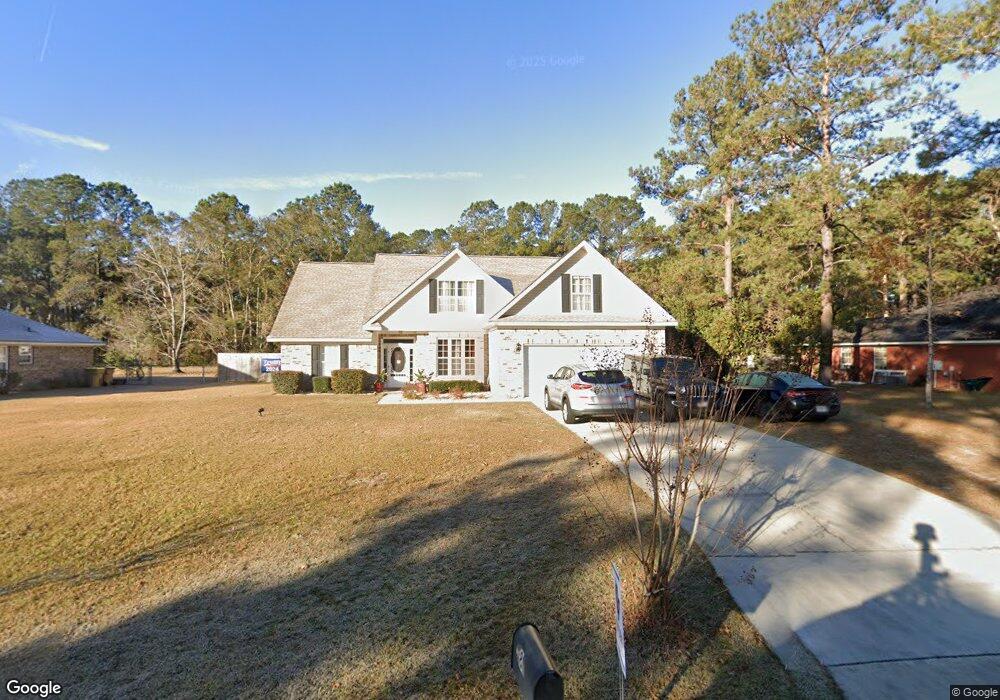
185 Huger St Rincon, GA 31326
Estimated Value: $319,040 - $346,000
Studio
1
Bath
2,065
Sq Ft
$159/Sq Ft
Est. Value
About This Home
This home is located at 185 Huger St, Rincon, GA 31326 and is currently estimated at $328,260, approximately $158 per square foot. 185 Huger St is a home located in Effingham County with nearby schools including South Effingham Elementary School, South Effingham Middle School, and South Effingham High School.
Ownership History
Date
Name
Owned For
Owner Type
Purchase Details
Closed on
Dec 1, 2021
Sold by
Stephenson Jacqueline S
Bought by
Stephenson Penny L
Current Estimated Value
Purchase Details
Closed on
Jul 20, 2015
Sold by
Vandine Ashleigh D
Bought by
Stephenson Jacqueline
Purchase Details
Closed on
Aug 8, 2012
Sold by
Vandine Ashleigh D
Bought by
Stephenson Jacqueline
Purchase Details
Closed on
Feb 16, 2012
Sold by
Stephenson Jacqueline
Bought by
Vandine Ashleigh D
Purchase Details
Closed on
Mar 23, 2007
Sold by
Blanks Gregory S
Bought by
Stephenson Jacqueline A
Create a Home Valuation Report for This Property
The Home Valuation Report is an in-depth analysis detailing your home's value as well as a comparison with similar homes in the area
Home Values in the Area
Average Home Value in this Area
Purchase History
| Date | Buyer | Sale Price | Title Company |
|---|---|---|---|
| Stephenson Penny L | -- | -- | |
| Stephenson Jacqueline | -- | -- | |
| Stephenson Jacqueline | -- | -- | |
| Vandine Ashleigh D | -- | -- | |
| Vandine Ashleigh D | -- | -- | |
| Stephenson Jacqueline A | $169,000 | -- |
Source: Public Records
Mortgage History
| Date | Status | Borrower | Loan Amount |
|---|---|---|---|
| Closed | Vandine Ashleigh D | -- |
Source: Public Records
Tax History
| Year | Tax Paid | Tax Assessment Tax Assessment Total Assessment is a certain percentage of the fair market value that is determined by local assessors to be the total taxable value of land and additions on the property. | Land | Improvement |
|---|---|---|---|---|
| 2025 | $3,735 | $108,260 | $22,800 | $85,460 |
| 2024 | $3,735 | $119,710 | $22,800 | $96,910 |
| 2023 | $3,480 | $116,593 | $18,800 | $97,793 |
| 2022 | $2,930 | $89,869 | $14,000 | $75,869 |
| 2021 | $2,743 | $83,074 | $14,000 | $69,074 |
| 2020 | $2,592 | $78,770 | $14,000 | $64,770 |
| 2019 | $2,445 | $73,230 | $14,000 | $59,230 |
| 2018 | $2,414 | $71,174 | $14,000 | $57,174 |
| 2017 | $2,357 | $68,634 | $14,000 | $54,634 |
| 2016 | $1,658 | $70,521 | $16,800 | $53,721 |
| 2015 | -- | $65,721 | $12,000 | $53,721 |
| 2014 | -- | $62,521 | $8,800 | $53,721 |
| 2013 | -- | $50,660 | $4,840 | $45,820 |
Source: Public Records
Map
Nearby Homes
Your Personal Tour Guide
Ask me questions while you tour the home.