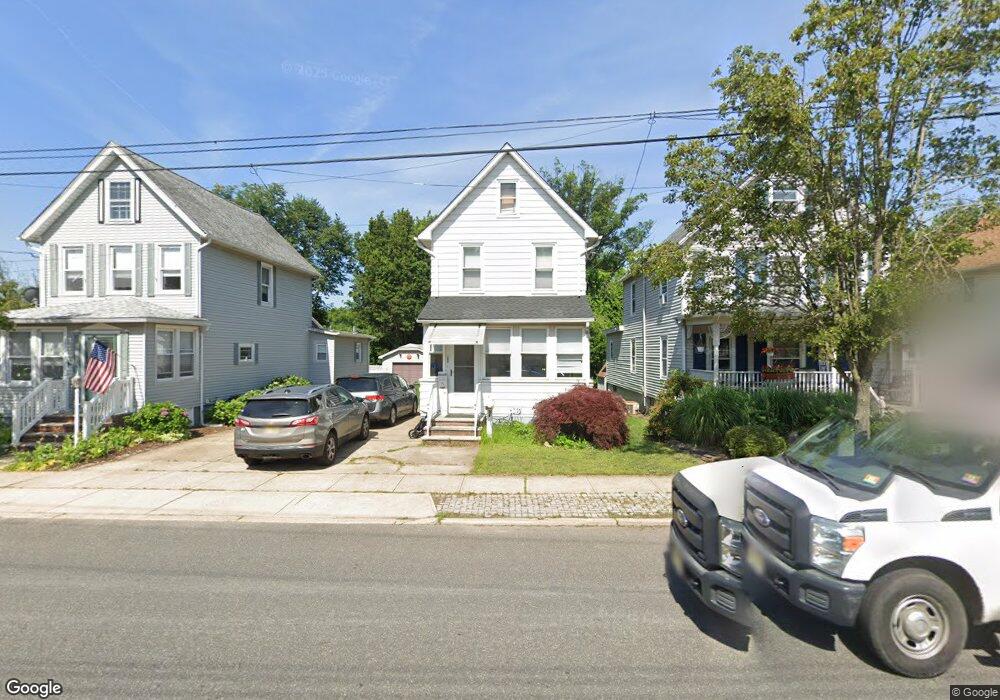
185 Main St Sayreville, NJ 08872
Estimated Value: $372,490 - $579,000
--
Bed
--
Bath
--
Sq Ft
3,398
Sq Ft Lot
About This Home
This home is located at 185 Main St, Sayreville, NJ 08872 and is currently estimated at $458,873. 185 Main St is a home located in Middlesex County with nearby schools including Sayreville War Memorial High School, St. Stanislaus Kostka School, and Darul Arqam School.
Ownership History
Date
Name
Owned For
Owner Type
Purchase Details
Closed on
Dec 20, 2002
Sold by
Kwitkoski John
Bought by
Spezzi Meghan
Current Estimated Value
Purchase Details
Closed on
Oct 6, 2000
Sold by
Panko Joan
Bought by
Kwitkowski John and Brauchle Meredith
Home Financials for this Owner
Home Financials are based on the most recent Mortgage that was taken out on this home.
Original Mortgage
$72,000
Interest Rate
7.88%
Create a Home Valuation Report for This Property
The Home Valuation Report is an in-depth analysis detailing your home's value as well as a comparison with similar homes in the area
Home Values in the Area
Average Home Value in this Area
Purchase History
| Date | Buyer | Sale Price | Title Company |
|---|---|---|---|
| Spezzi Meghan | $185,000 | -- | |
| Kwitkowski John | $90,000 | -- |
Source: Public Records
Mortgage History
| Date | Status | Borrower | Loan Amount |
|---|---|---|---|
| Previous Owner | Kwitkowski John | $72,000 |
Source: Public Records
Tax History Compared to Growth
Tax History
| Year | Tax Paid | Tax Assessment Tax Assessment Total Assessment is a certain percentage of the fair market value that is determined by local assessors to be the total taxable value of land and additions on the property. | Land | Improvement |
|---|---|---|---|---|
| 2025 | $5,556 | $91,000 | $41,300 | $49,700 |
| 2024 | $5,402 | $91,000 | $41,300 | $49,700 |
| 2023 | $5,402 | $91,000 | $41,300 | $49,700 |
| 2022 | $5,046 | $91,000 | $41,300 | $49,700 |
| 2021 | $4,990 | $91,000 | $41,300 | $49,700 |
| 2020 | $4,864 | $91,000 | $41,300 | $49,700 |
| 2019 | $4,762 | $91,000 | $41,300 | $49,700 |
| 2018 | $4,676 | $91,000 | $41,300 | $49,700 |
| 2017 | $4,568 | $91,000 | $41,300 | $49,700 |
| 2016 | $4,446 | $91,000 | $41,300 | $49,700 |
| 2015 | $4,345 | $91,000 | $41,300 | $49,700 |
| 2014 | $4,229 | $91,000 | $41,300 | $49,700 |
Source: Public Records
Map
Nearby Homes