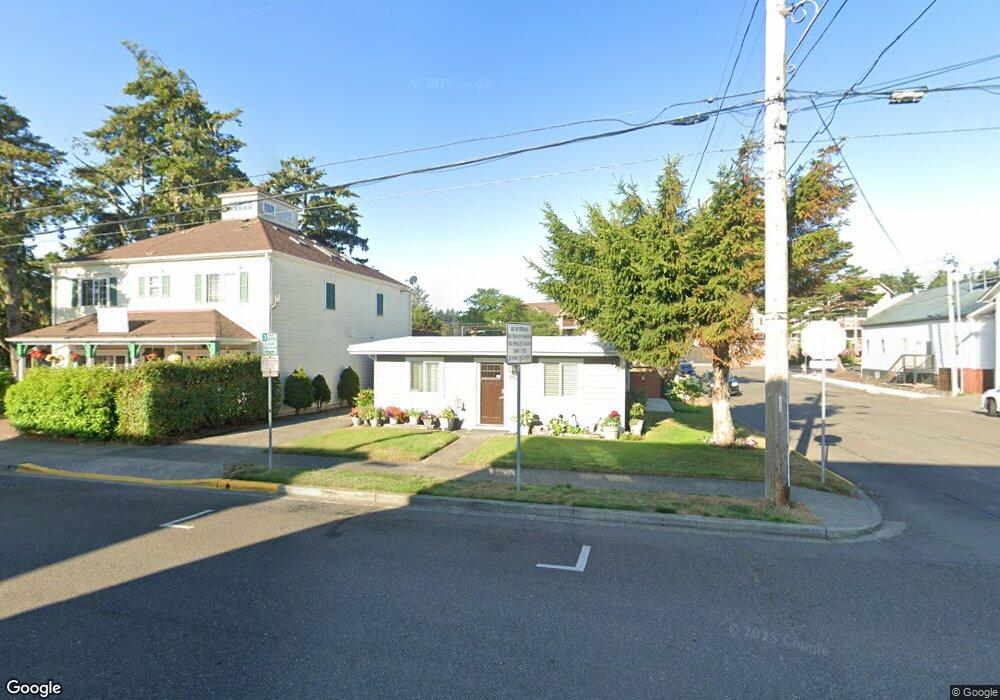
185 Maple St Florence, OR 97439
Estimated Value: $324,000 - $422,000
2
Beds
1
Bath
1,308
Sq Ft
$288/Sq Ft
Est. Value
About This Home
This home is located at 185 Maple St, Florence, OR 97439 and is currently estimated at $376,222, approximately $287 per square foot. 185 Maple St is a home located in Lane County with nearby schools including Siuslaw Elementary School, Siuslaw Middle School, and Siuslaw High School.
Ownership History
Date
Name
Owned For
Owner Type
Purchase Details
Closed on
Aug 25, 2015
Sold by
Rana Pabin N and Rana Anju
Bought by
Hanson Maynard M
Current Estimated Value
Home Financials for this Owner
Home Financials are based on the most recent Mortgage that was taken out on this home.
Original Mortgage
$151,050
Outstanding Balance
$58,043
Interest Rate
4.05%
Mortgage Type
New Conventional
Estimated Equity
$318,179
Purchase Details
Closed on
Apr 26, 2005
Sold by
Tompkins Winfred Neil and Tompkins Edith May
Bought by
Rana Pabin N and Rana Anju
Purchase Details
Closed on
Sep 10, 2004
Sold by
Tompkins Winfred Neil and Tompkins Edith May
Bought by
Rana Pabin N and Rana Anju
Purchase Details
Closed on
Sep 2, 2004
Sold by
Heeter Van M and Heeter Kathleen M
Bought by
Tompkins Winfred Neil and Tompkins Edith May
Create a Home Valuation Report for This Property
The Home Valuation Report is an in-depth analysis detailing your home's value as well as a comparison with similar homes in the area
Home Values in the Area
Average Home Value in this Area
Purchase History
| Date | Buyer | Sale Price | Title Company |
|---|---|---|---|
| Hanson Maynard M | $163,000 | Cascade Title Company | |
| Rana Pabin N | -- | Western Pioneer Title Co | |
| Rana Pabin N | $130,000 | Western Pioneer Title Co | |
| Tompkins Winfred Neil | -- | Western Pioneer Title Co |
Source: Public Records
Mortgage History
| Date | Status | Borrower | Loan Amount |
|---|---|---|---|
| Open | Hanson Maynard M | $151,050 |
Source: Public Records
Tax History
| Year | Tax Paid | Tax Assessment Tax Assessment Total Assessment is a certain percentage of the fair market value that is determined by local assessors to be the total taxable value of land and additions on the property. | Land | Improvement |
|---|---|---|---|---|
| 2025 | $1,748 | $159,704 | -- | -- |
| 2024 | $1,698 | $155,053 | -- | -- |
| 2023 | $1,698 | $150,537 | -- | -- |
| 2022 | $1,584 | $146,153 | $0 | $0 |
| 2021 | $1,551 | $141,897 | $0 | $0 |
| 2020 | $1,511 | $137,765 | $0 | $0 |
| 2019 | $1,454 | $133,753 | $0 | $0 |
| 2018 | $1,816 | $126,076 | $0 | $0 |
| 2017 | $1,752 | $126,076 | $0 | $0 |
| 2016 | $1,702 | $122,404 | $0 | $0 |
| 2015 | $1,665 | $118,839 | $0 | $0 |
| 2014 | $1,648 | $115,378 | $0 | $0 |
Source: Public Records
Map
Nearby Homes
- 179 Laurel St Unit 9
- 1184 2nd St
- 289 Harbor St
- 1080 Bay St Unit 19
- 290 Harbor St
- 1070 Bay St Unit 22
- 1040 Bay St Unit 14
- 0 Hemlock St Unit 24176357
- 0 Hemlock St Unit 23650308
- 0 Hemlock St Unit 583848803
- 1317 7th St
- 1335 7th St
- 1495 8th St
- 85675 Glenada Rd
- 1036 9th St
- 1260 10th St Unit 5
- 2155 9th St
- 2040 11th St
- 1150 Hemlock St Unit C11
- 1150 Hemlock St Unit D14
Your Personal Tour Guide
Ask me questions while you tour the home.