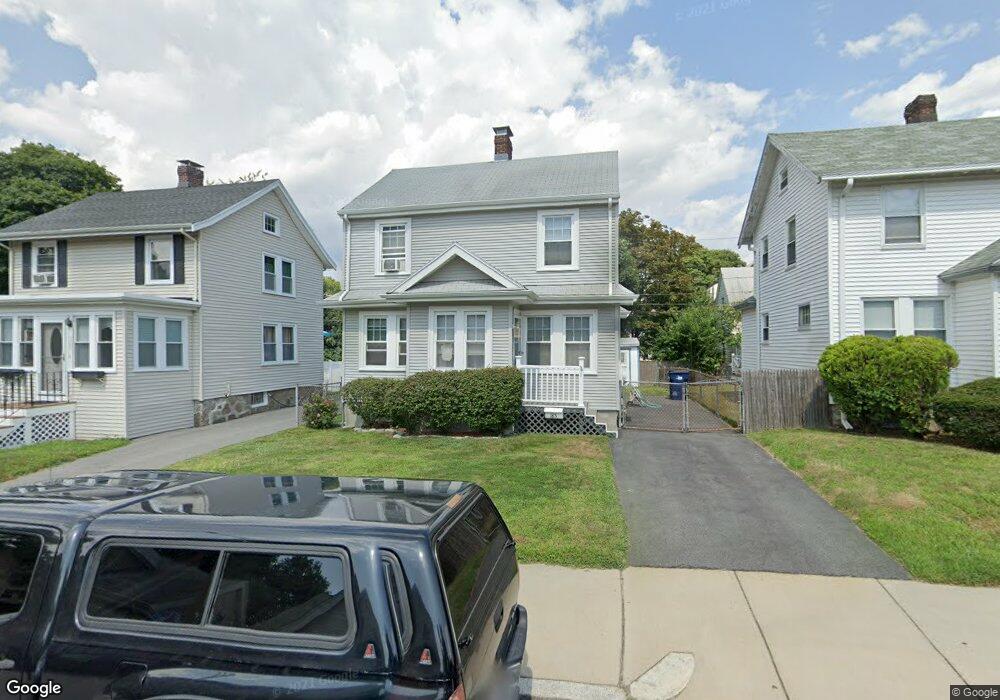
185 Maple St West Roxbury, MA 02132
West Roxbury NeighborhoodEstimated Value: $677,000 - $906,000
2
Beds
1
Bath
101
Sq Ft
$7,641/Sq Ft
Est. Value
About This Home
This home is located at 185 Maple St, West Roxbury, MA 02132 and is currently estimated at $771,781, approximately $7,641 per square foot. 185 Maple St is a home located in Suffolk County with nearby schools including Holy Name Parish School, St Theresa School, and The Roxbury Latin School.
Ownership History
Date
Name
Owned For
Owner Type
Purchase Details
Closed on
Jan 23, 2026
Sold by
Pate Thomas and Toy Judy
Bought by
Pate Ft and Pate
Current Estimated Value
Purchase Details
Closed on
Jun 30, 1995
Sold by
Costello Lynn
Bought by
Toy Judy
Home Financials for this Owner
Home Financials are based on the most recent Mortgage that was taken out on this home.
Original Mortgage
$135,375
Interest Rate
7.8%
Mortgage Type
Purchase Money Mortgage
Purchase Details
Closed on
Aug 9, 1991
Sold by
Jean M Est Bowes and Macmillan Marcia H
Bought by
Costello Lynn
Create a Home Valuation Report for This Property
The Home Valuation Report is an in-depth analysis detailing your home's value as well as a comparison with similar homes in the area
Home Values in the Area
Average Home Value in this Area
Purchase History
We collect this data history from publicly available records. To have your information removed, we recommend requesting removal directly through your county’s website.
| Date | Buyer | Sale Price | Title Company |
|---|---|---|---|
| Pate Ft | -- | -- | |
| Toy Judy | $142,500 | -- | |
| Costello Lynn | $127,800 | -- |
Source: Public Records
Mortgage History
We collect this data history from publicly available records. To have your information removed, we recommend requesting removal directly through your county’s website.
| Date | Status | Borrower | Loan Amount |
|---|---|---|---|
| Previous Owner | Costello Lynn | $143,500 | |
| Previous Owner | Costello Lynn | $146,000 | |
| Previous Owner | Costello Lynn | $135,375 | |
| Previous Owner | Costello Lynn | $107,900 |
Source: Public Records
Tax History
| Year | Tax Paid | Tax Assessment Tax Assessment Total Assessment is a certain percentage of the fair market value that is determined by local assessors to be the total taxable value of land and additions on the property. | Land | Improvement |
|---|---|---|---|---|
| 2025 | $7,345 | $634,300 | $260,500 | $373,800 |
| 2024 | $5,896 | $540,900 | $219,400 | $321,500 |
| 2023 | $5,478 | $510,100 | $206,900 | $303,200 |
| 2022 | $5,045 | $463,700 | $188,100 | $275,600 |
| 2021 | $4,641 | $435,000 | $180,900 | $254,100 |
| 2020 | $4,400 | $416,700 | $164,100 | $252,600 |
| 2019 | $4,104 | $389,400 | $138,500 | $250,900 |
| 2018 | $3,925 | $374,500 | $138,500 | $236,000 |
| 2017 | $3,926 | $370,700 | $138,500 | $232,200 |
| 2016 | $3,812 | $346,500 | $138,500 | $208,000 |
| 2015 | $3,838 | $316,900 | $143,400 | $173,500 |
| 2014 | $3,877 | $308,200 | $141,400 | $166,800 |
Source: Public Records
Map
Nearby Homes
- 188 Maple St
- 589 Weld St
- 3 Vermont St
- 45 Bonair St
- 390 Weld St Unit 2
- 291 Russett Rd
- 303 Russett Rd
- 52 Park St
- 89 Newfield St
- 25 Clearwater Rd
- 1 Furbush Rd
- 96 Anderer Ln Unit 5
- 829 Lagrange St Unit 3
- 99 Anderer Ln Unit 8
- 100 Anderer Ln Unit 2
- 1721 Centre St Unit 402
- 1721 Centre St Unit 304
- 11 Sherbrook St
- 177 Perham St
- 923 Lagrange St
Your Personal Tour Guide
Ask me questions while you tour the home.