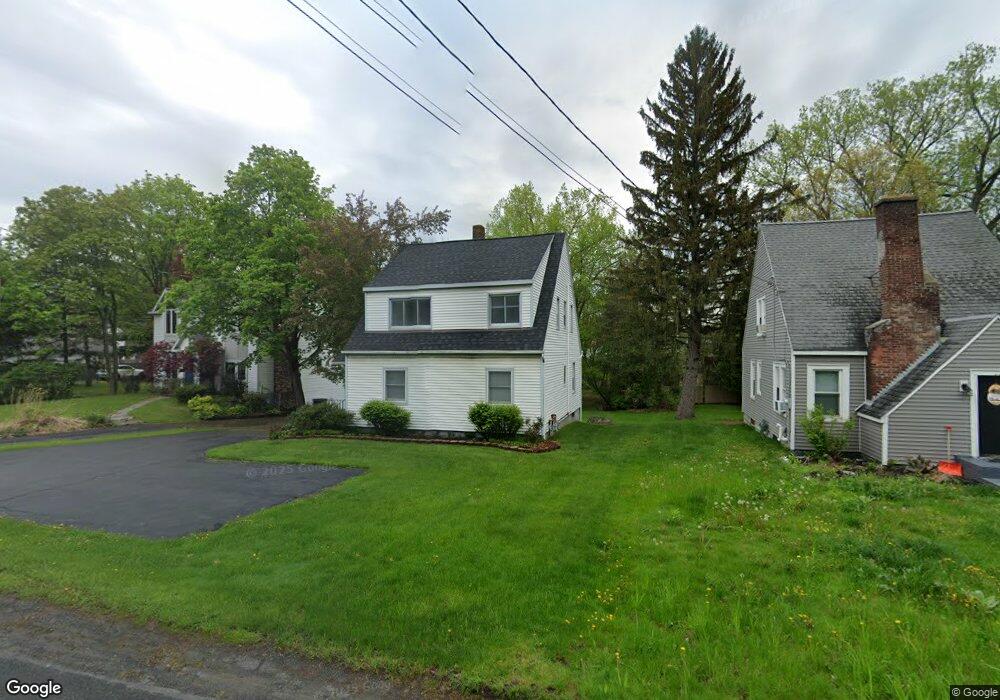
185 Menand Rd Albany, NY 12211
Estimated Value: $282,000 - $363,000
4
Beds
2
Baths
1,600
Sq Ft
$200/Sq Ft
Est. Value
About This Home
This home is located at 185 Menand Rd, Albany, NY 12211 and is currently estimated at $320,449, approximately $200 per square foot. 185 Menand Rd is a home located in Albany County with nearby schools including Southgate School, Shaker Junior High School, and Shaker High School.
Ownership History
Date
Name
Owned For
Owner Type
Purchase Details
Closed on
Jun 29, 2006
Sold by
Caulfield Timothy J
Bought by
Gosai Nayan
Current Estimated Value
Home Financials for this Owner
Home Financials are based on the most recent Mortgage that was taken out on this home.
Original Mortgage
$168,300
Outstanding Balance
$99,640
Interest Rate
6.6%
Estimated Equity
$220,810
Purchase Details
Closed on
Aug 16, 1996
Sold by
Kenney Nelson G
Bought by
Caulfield Timothy J and Tweeddale Cora L
Create a Home Valuation Report for This Property
The Home Valuation Report is an in-depth analysis detailing your home's value as well as a comparison with similar homes in the area
Home Values in the Area
Average Home Value in this Area
Purchase History
| Date | Buyer | Sale Price | Title Company |
|---|---|---|---|
| Gosai Nayan | $187,000 | Susan A. Hoblock | |
| Gosai Pooja | $187,000 | None Available | |
| Caulfield Timothy J | $94,000 | -- |
Source: Public Records
Mortgage History
| Date | Status | Borrower | Loan Amount |
|---|---|---|---|
| Open | Gosai Pooja | $168,300 | |
| Closed | Gosai Nayan | $168,300 |
Source: Public Records
Tax History Compared to Growth
Tax History
| Year | Tax Paid | Tax Assessment Tax Assessment Total Assessment is a certain percentage of the fair market value that is determined by local assessors to be the total taxable value of land and additions on the property. | Land | Improvement |
|---|---|---|---|---|
| 2024 | $4,434 | $94,000 | $23,500 | $70,500 |
| 2023 | $4,304 | $94,000 | $23,500 | $70,500 |
| 2022 | $4,170 | $94,000 | $23,500 | $70,500 |
| 2021 | $4,154 | $94,000 | $23,500 | $70,500 |
| 2020 | $4,060 | $94,000 | $23,500 | $70,500 |
| 2019 | $1,907 | $94,000 | $23,500 | $70,500 |
| 2018 | $3,998 | $94,000 | $23,500 | $70,500 |
| 2017 | $0 | $94,000 | $23,500 | $70,500 |
| 2016 | $3,849 | $94,000 | $23,500 | $70,500 |
| 2015 | -- | $94,000 | $23,500 | $70,500 |
| 2014 | -- | $94,000 | $23,500 | $70,500 |
Source: Public Records
Map
Nearby Homes
- 30 Princess Ln
- 11 Fenway Dr
- 3 Chestnut Hill Rd N
- 44 Turner Ln
- 10 Willo Ln
- 18 Sage Hill Ln
- 9 Laurel Dr
- 12 Delucia Terrace
- 4 N Sage Hill Ln
- 109 Woods Ln
- 112 Woods Ln
- 8 Sage Estates
- 5 Gibbs Cir
- 522 Loudon Rd
- 9 Sky Hollow Dr
- 4 Hilander Dr
- 4 Wedgewood Dr
- 417 Albany Shaker Rd
- 6 Wedgewood Dr
- 1 Sterling Ridge