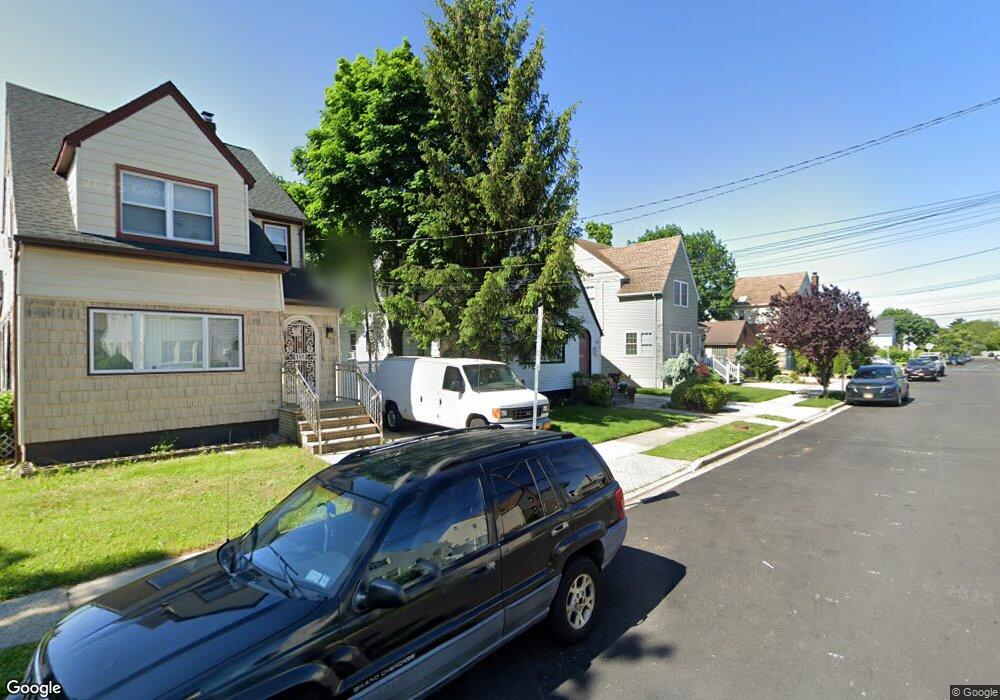
185 Oak St Unit Upper West Hempstead, NY 11552
Estimated Value: $778,000 - $780,728
3
Beds
1
Bath
1,696
Sq Ft
$460/Sq Ft
Est. Value
About This Home
This home is located at 185 Oak St Unit Upper, West Hempstead, NY 11552 and is currently estimated at $779,364, approximately $459 per square foot. 185 Oak St Unit Upper is a home located in Nassau County with nearby schools including Chestnut Street School, West Hempstead Secondary School, and Crescent School.
Ownership History
Date
Name
Owned For
Owner Type
Purchase Details
Closed on
Sep 29, 2025
Sold by
Marie Lewis
Bought by
Marie Lewis and Marie David
Current Estimated Value
Purchase Details
Closed on
Jan 21, 2010
Sold by
Hsbc Bank Usa Na
Bought by
Maier Lewis
Purchase Details
Closed on
Feb 24, 2009
Sold by
Referee Of Nassau County and Hausch Esq
Bought by
Hsbc Bank Usa Na
Purchase Details
Closed on
Feb 9, 1999
Sold by
Saitta Martina
Bought by
Rodriguez Rafael
Create a Home Valuation Report for This Property
The Home Valuation Report is an in-depth analysis detailing your home's value as well as a comparison with similar homes in the area
Home Values in the Area
Average Home Value in this Area
Purchase History
| Date | Buyer | Sale Price | Title Company |
|---|---|---|---|
| Marie Lewis | -- | None Available | |
| Maier Lewis | $255,000 | -- | |
| Maier Lewis | $255,000 | -- | |
| Hsbc Bank Usa Na | $467,228 | None Available | |
| Hsbc Bank Usa Na | $467,228 | None Available | |
| Rodriguez Rafael | $200,000 | -- |
Source: Public Records
Mortgage History
| Date | Status | Borrower | Loan Amount |
|---|---|---|---|
| Closed | Hsbc Bank Usa Na | $0 |
Source: Public Records
Tax History Compared to Growth
Tax History
| Year | Tax Paid | Tax Assessment Tax Assessment Total Assessment is a certain percentage of the fair market value that is determined by local assessors to be the total taxable value of land and additions on the property. | Land | Improvement |
|---|---|---|---|---|
| 2025 | $13,284 | $466 | $198 | $268 |
| 2024 | $4,122 | $467 | $198 | $269 |
| 2023 | $12,375 | $494 | $210 | $284 |
| 2022 | $12,375 | $485 | $206 | $279 |
| 2021 | $11,623 | $470 | $199 | $271 |
| 2020 | $5,520 | $565 | $458 | $107 |
| 2019 | $10,385 | $606 | $461 | $145 |
| 2018 | $10,480 | $646 | $0 | $0 |
| 2017 | $7,194 | $683 | $491 | $192 |
| 2016 | $10,605 | $683 | $375 | $308 |
| 2015 | $3,181 | $683 | $375 | $308 |
| 2014 | $3,181 | $683 | $375 | $308 |
| 2013 | $3,898 | $894 | $491 | $403 |
Source: Public Records
Map
Nearby Homes