Estimated Value: $264,000 - $296,000
3
Beds
3
Baths
1,248
Sq Ft
$221/Sq Ft
Est. Value
About This Home
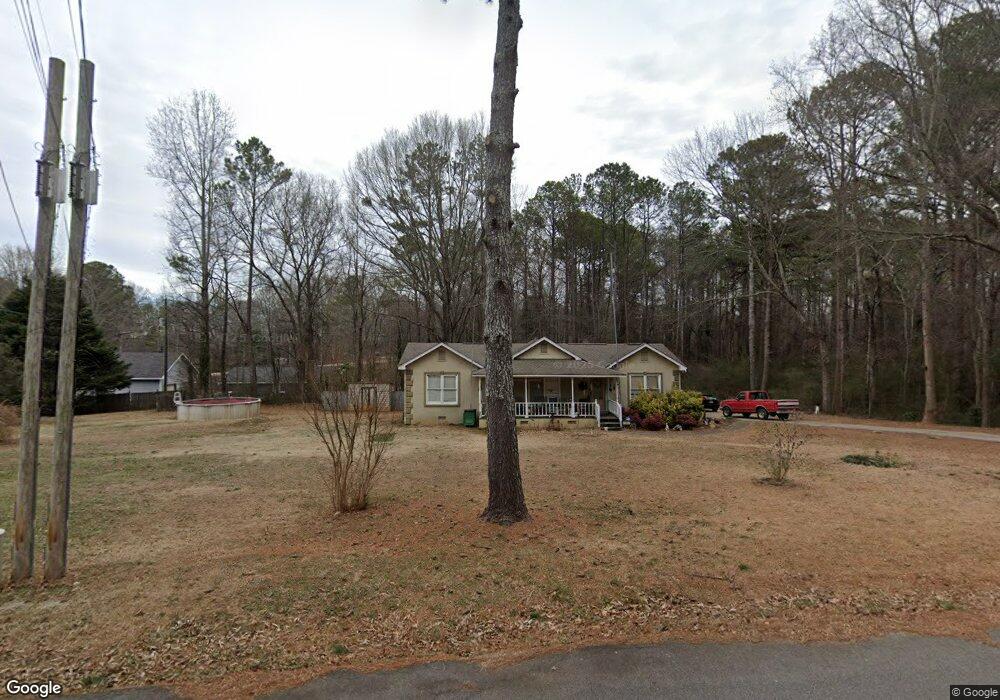
This home is located at 185 Old Sudie Rd, Hiram, GA 30141 and is currently estimated at $275,677, approximately $220 per square foot. 185 Old Sudie Rd is a home located in Paulding County with nearby schools including Allgood Elementary School, Herschel Jones Middle School, and Paulding County High School.
Ownership History
Date
Name
Owned For
Owner Type
Purchase Details
Closed on
Mar 23, 2004
Sold by
Cit Grp Of Consumer Fin
Bought by
Mitchell Barbara
Current Estimated Value
Home Financials for this Owner
Home Financials are based on the most recent Mortgage that was taken out on this home.
Original Mortgage
$77,309
Outstanding Balance
$35,776
Interest Rate
5.53%
Mortgage Type
New Conventional
Estimated Equity
$239,901
Create a Home Valuation Report for This Property
The Home Valuation Report is an in-depth analysis detailing your home's value as well as a comparison with similar homes in the area
Home Values in the Area
Average Home Value in this Area
Purchase History
| Date | Buyer | Sale Price | Title Company |
|---|---|---|---|
| Mitchell Barbara | $79,700 | -- |
Source: Public Records
Mortgage History
| Date | Status | Borrower | Loan Amount |
|---|---|---|---|
| Open | Mitchell Barbara | $77,309 |
Source: Public Records
Tax History Compared to Growth
Tax History
| Year | Tax Paid | Tax Assessment Tax Assessment Total Assessment is a certain percentage of the fair market value that is determined by local assessors to be the total taxable value of land and additions on the property. | Land | Improvement |
|---|---|---|---|---|
| 2024 | $2,581 | $106,984 | $11,280 | $95,704 |
| 2023 | $2,628 | $103,344 | $10,920 | $92,424 |
| 2022 | $2,219 | $86,992 | $9,440 | $77,552 |
| 2021 | $1,881 | $66,596 | $7,680 | $58,916 |
| 2020 | $1,744 | $60,560 | $7,960 | $52,600 |
| 2019 | $1,603 | $55,048 | $8,160 | $46,888 |
| 2018 | $1,455 | $50,156 | $8,120 | $42,036 |
| 2017 | $1,377 | $46,944 | $8,120 | $38,824 |
| 2016 | $1,039 | $36,224 | $7,720 | $28,504 |
| 2015 | $964 | $33,168 | $6,880 | $26,288 |
| 2014 | $893 | $30,136 | $6,560 | $23,576 |
| 2013 | -- | $25,640 | $7,320 | $18,320 |
Source: Public Records
Map
Nearby Homes
- 1392 Hiram Sudie Rd
- 162 Old Sudie Rd
- 178 Old Sudie Rd
- 231 Old Sudie Rd
- 132 Old Sudie Rd
- 243 Old Sudie Rd
- 218 Old Sudie Rd
- 1298 Hiram Sudie Rd
- 1410 Hiram Sudie Rd
- 1406 Hiram Sudie Rd
- 236 Old Sudie Rd
- 279 Old Sudie Rd
- 1325 Hiram Sudie Rd
- 270 Old Sudie Rd
- 1496 Hiram Sudie Rd
- 44 Old Sudie Rd
- 1391 Hiram Sudie Rd
- 1 Harrow Ct
- 9 Harrow Ct
- 301 Old Sudie Rd