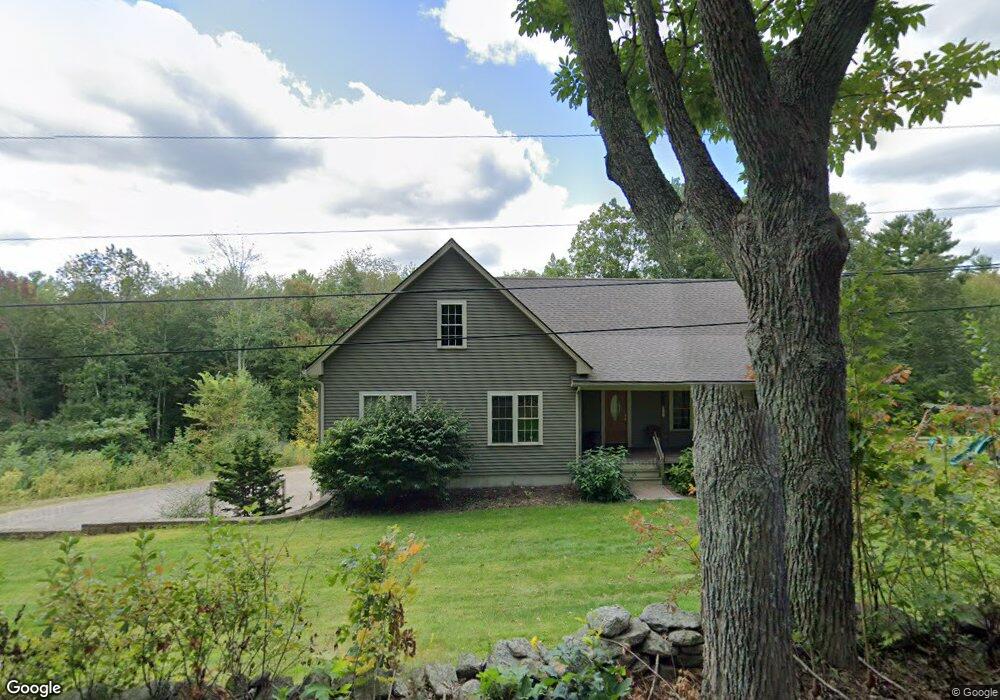
185 Paxton Rd Spencer, MA 01562
Estimated Value: $478,304 - $546,000
3
Beds
2
Baths
1,508
Sq Ft
$343/Sq Ft
Est. Value
About This Home
This home is located at 185 Paxton Rd, Spencer, MA 01562 and is currently estimated at $516,826, approximately $342 per square foot. 185 Paxton Rd is a home located in Worcester County with nearby schools including David Prouty High School.
Ownership History
Date
Name
Owned For
Owner Type
Purchase Details
Closed on
Nov 30, 2006
Sold by
Andrews Nancy A
Bought by
Masterson Raphelle M and Masterson Timothy I
Current Estimated Value
Home Financials for this Owner
Home Financials are based on the most recent Mortgage that was taken out on this home.
Original Mortgage
$45,000
Outstanding Balance
$26,979
Interest Rate
6.36%
Mortgage Type
Purchase Money Mortgage
Estimated Equity
$489,847
Purchase Details
Closed on
Oct 1, 2004
Sold by
Andrews Albert E and Andrews Nancy A
Bought by
Kennen Jason E and Cutler Jessica A
Home Financials for this Owner
Home Financials are based on the most recent Mortgage that was taken out on this home.
Original Mortgage
$125,000
Interest Rate
5.81%
Mortgage Type
Purchase Money Mortgage
Create a Home Valuation Report for This Property
The Home Valuation Report is an in-depth analysis detailing your home's value as well as a comparison with similar homes in the area
Home Values in the Area
Average Home Value in this Area
Purchase History
| Date | Buyer | Sale Price | Title Company |
|---|---|---|---|
| Masterson Raphelle M | $65,000 | -- | |
| Kennen Jason E | $50,000 | -- |
Source: Public Records
Mortgage History
| Date | Status | Borrower | Loan Amount |
|---|---|---|---|
| Open | Masterson Raphelle M | $45,000 | |
| Previous Owner | Kennen Jason E | $125,000 |
Source: Public Records
Tax History Compared to Growth
Tax History
| Year | Tax Paid | Tax Assessment Tax Assessment Total Assessment is a certain percentage of the fair market value that is determined by local assessors to be the total taxable value of land and additions on the property. | Land | Improvement |
|---|---|---|---|---|
| 2025 | $51 | $438,100 | $54,500 | $383,600 |
| 2024 | $4,647 | $406,200 | $54,500 | $351,700 |
| 2023 | $4,321 | $358,300 | $54,500 | $303,800 |
| 2022 | $4,259 | $323,600 | $49,500 | $274,100 |
| 2021 | $4,098 | $291,900 | $49,500 | $242,400 |
| 2020 | $3,786 | $268,100 | $49,500 | $218,600 |
| 2019 | $3,670 | $264,800 | $45,000 | $219,800 |
| 2018 | $3,072 | $228,900 | $52,200 | $176,700 |
| 2017 | $3,000 | $214,600 | $49,500 | $165,100 |
| 2016 | $2,971 | $207,900 | $49,500 | $158,400 |
| 2015 | $2,882 | $210,800 | $54,900 | $155,900 |
| 2014 | $2,772 | $210,800 | $54,900 | $155,900 |
Source: Public Records
Map
Nearby Homes