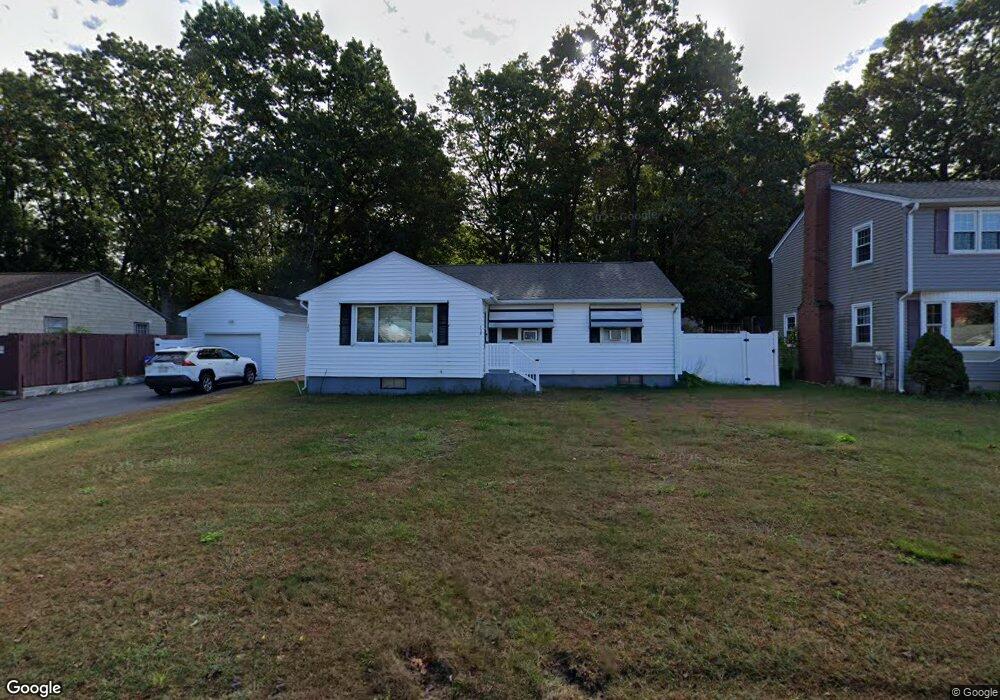
185 Roy St Springfield, MA 01104
Liberty Heights NeighborhoodEstimated Value: $284,000 - $328,000
3
Beds
2
Baths
1,246
Sq Ft
$241/Sq Ft
Est. Value
About This Home
This home is located at 185 Roy St, Springfield, MA 01104 and is currently estimated at $300,283, approximately $240 per square foot. 185 Roy St is a home located in Hampden County with nearby schools including Mary O. Pottenger Elementary School, Van Sickle Academy, and High School Of Commerce.
Ownership History
Date
Name
Owned For
Owner Type
Purchase Details
Closed on
Apr 1, 2014
Sold by
Diaz Cheydy S
Bought by
Gonzalez Eugenio
Current Estimated Value
Purchase Details
Closed on
Nov 23, 2011
Sold by
Gonzalez Eugenio
Bought by
Gonzalez Eugenio and Diaz Cheydy S
Purchase Details
Closed on
Aug 31, 2011
Sold by
Toney Sylvester and Snowden Vicki
Bought by
Gonzalez Eugenio
Home Financials for this Owner
Home Financials are based on the most recent Mortgage that was taken out on this home.
Original Mortgage
$118,907
Interest Rate
4.5%
Mortgage Type
FHA
Purchase Details
Closed on
Oct 11, 1995
Sold by
Haley Constance D
Bought by
Toney Sylvester and Snowden-Toney Vicki
Home Financials for this Owner
Home Financials are based on the most recent Mortgage that was taken out on this home.
Original Mortgage
$82,900
Interest Rate
7.71%
Mortgage Type
Purchase Money Mortgage
Create a Home Valuation Report for This Property
The Home Valuation Report is an in-depth analysis detailing your home's value as well as a comparison with similar homes in the area
Home Values in the Area
Average Home Value in this Area
Purchase History
| Date | Buyer | Sale Price | Title Company |
|---|---|---|---|
| Gonzalez Eugenio | -- | -- | |
| Gonzalez Eugenio | -- | -- | |
| Gonzalez Eugenio | $122,000 | -- | |
| Toney Sylvester | $83,000 | -- |
Source: Public Records
Mortgage History
| Date | Status | Borrower | Loan Amount |
|---|---|---|---|
| Previous Owner | Gonzalez Eugenio | $118,907 | |
| Previous Owner | Toney Sylvester | $82,900 |
Source: Public Records
Tax History
| Year | Tax Paid | Tax Assessment Tax Assessment Total Assessment is a certain percentage of the fair market value that is determined by local assessors to be the total taxable value of land and additions on the property. | Land | Improvement |
|---|---|---|---|---|
| 2025 | $3,583 | $228,500 | $39,900 | $188,600 |
| 2024 | $3,024 | $188,300 | $39,900 | $148,400 |
| 2023 | $2,991 | $175,400 | $35,300 | $140,100 |
| 2022 | $2,932 | $155,800 | $33,000 | $122,800 |
| 2021 | $2,890 | $152,900 | $30,000 | $122,900 |
| 2020 | $2,779 | $142,300 | $30,000 | $112,300 |
| 2019 | $2,588 | $131,500 | $32,600 | $98,900 |
| 2018 | $2,556 | $129,900 | $32,600 | $97,300 |
| 2017 | $2,434 | $123,800 | $29,500 | $94,300 |
| 2016 | $2,365 | $120,300 | $28,000 | $92,300 |
| 2015 | $2,323 | $118,100 | $28,000 | $90,100 |
Source: Public Records
Map
Nearby Homes
Your Personal Tour Guide
Ask me questions while you tour the home.