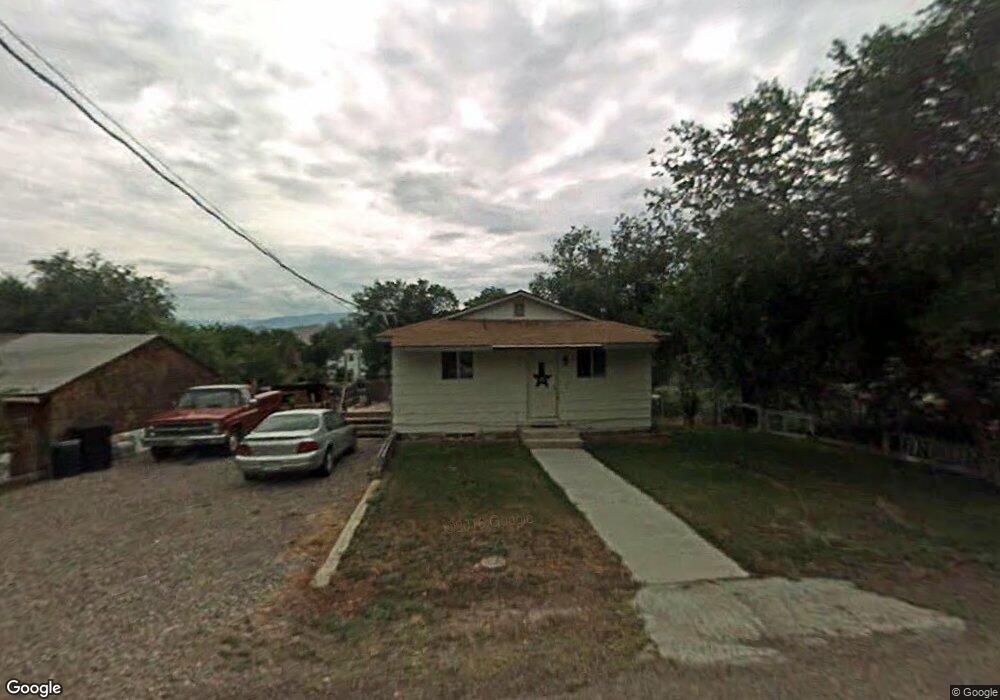
185 S 200 W Redmond, UT 84652
Estimated Value: $193,000 - $246,642
3
Beds
2
Baths
1,900
Sq Ft
$119/Sq Ft
Est. Value
About This Home
This home is located at 185 S 200 W, Redmond, UT 84652 and is currently estimated at $226,214, approximately $119 per square foot. 185 S 200 W is a home located in Sevier County with nearby schools including Salina School, North Sevier Middle School, and North Sevier High School.
Ownership History
Date
Name
Owned For
Owner Type
Purchase Details
Closed on
Mar 2, 2020
Sold by
Childs Lenna C
Bought by
Childs Kevin L
Current Estimated Value
Purchase Details
Closed on
Mar 22, 2010
Sold by
Hokanson Kirk R
Bought by
Childs Kevin L and Childs Lenna C
Home Financials for this Owner
Home Financials are based on the most recent Mortgage that was taken out on this home.
Original Mortgage
$88,000
Outstanding Balance
$57,340
Interest Rate
4.88%
Mortgage Type
Purchase Money Mortgage
Estimated Equity
$168,874
Purchase Details
Closed on
Apr 28, 2008
Sold by
Martinez Paul I and Martinez Paul L
Bought by
Hokanson Kirk R
Purchase Details
Closed on
Feb 16, 2007
Sold by
Martinez Paul I and Martinez Vicki R
Bought by
Hokanson Kirk R
Home Financials for this Owner
Home Financials are based on the most recent Mortgage that was taken out on this home.
Original Mortgage
$18,400
Interest Rate
6.21%
Mortgage Type
Stand Alone Second
Create a Home Valuation Report for This Property
The Home Valuation Report is an in-depth analysis detailing your home's value as well as a comparison with similar homes in the area
Purchase History
| Date | Buyer | Sale Price | Title Company |
|---|---|---|---|
| Childs Kevin L | -- | Accommodation | |
| Childs Kevin L | -- | United Title Services | |
| Hokanson Kirk R | -- | First American Title Ins Age | |
| Hokanson Kirk R | -- | First American Title Co |
Source: Public Records
Mortgage History
| Date | Status | Borrower | Loan Amount |
|---|---|---|---|
| Open | Childs Kevin L | $88,000 | |
| Previous Owner | Hokanson Kirk R | $18,400 | |
| Previous Owner | Hokanson Kirk R | $73,600 |
Source: Public Records
Tax History
| Year | Tax Paid | Tax Assessment Tax Assessment Total Assessment is a certain percentage of the fair market value that is determined by local assessors to be the total taxable value of land and additions on the property. | Land | Improvement |
|---|---|---|---|---|
| 2025 | $1,588 | $187,787 | $47,965 | $139,822 |
| 2024 | $1,588 | $162,929 | $42,754 | $120,175 |
| 2023 | $1,407 | $169,731 | $43,006 | $126,725 |
| 2022 | $2,293 | $231,824 | $44,595 | $187,229 |
| 2021 | $1,326 | $110,899 | $25,000 | $85,899 |
| 2020 | $639 | $50,088 | $13,750 | $36,338 |
| 2019 | $584 | $48,880 | $13,750 | $35,130 |
| 2018 | $534 | $39,590 | $12,380 | $27,210 |
| 2017 | $533 | $37,710 | $12,380 | $25,330 |
| 2016 | $455 | $35,610 | $0 | $0 |
| 2015 | $455 | $35,610 | $0 | $0 |
| 2014 | $455 | $37,560 | $0 | $0 |
Source: Public Records
Map
Nearby Homes
Your Personal Tour Guide
Ask me questions while you tour the home.