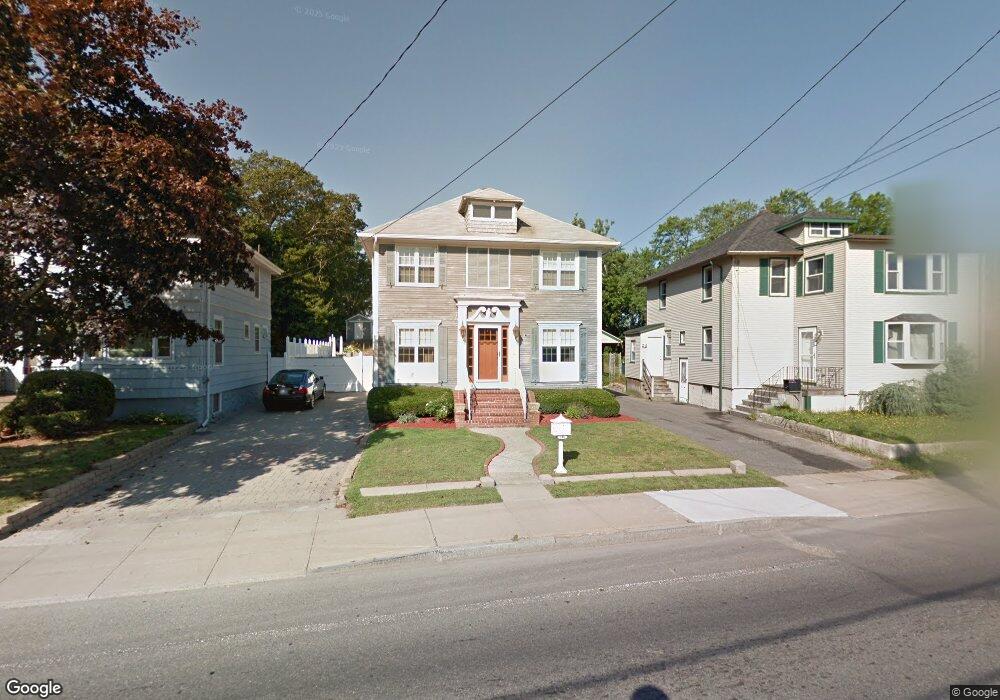
185 S Main St Acushnet, MA 02743
Estimated Value: $475,000 - $533,000
3
Beds
3
Baths
2,056
Sq Ft
$243/Sq Ft
Est. Value
About This Home
This home is located at 185 S Main St, Acushnet, MA 02743 and is currently estimated at $500,419, approximately $243 per square foot. 185 S Main St is a home located in Bristol County with nearby schools including Acushnet Elementary School, Albert F Ford Middle School, and Alma Del Mar Charter School.
Ownership History
Date
Name
Owned For
Owner Type
Purchase Details
Closed on
Nov 30, 2005
Sold by
Whalen Jean C and Whalen William H
Bought by
Santos Brenda and Santos Robert O
Current Estimated Value
Home Financials for this Owner
Home Financials are based on the most recent Mortgage that was taken out on this home.
Original Mortgage
$260,000
Outstanding Balance
$142,479
Interest Rate
6.14%
Mortgage Type
Purchase Money Mortgage
Estimated Equity
$357,940
Create a Home Valuation Report for This Property
The Home Valuation Report is an in-depth analysis detailing your home's value as well as a comparison with similar homes in the area
Home Values in the Area
Average Home Value in this Area
Purchase History
| Date | Buyer | Sale Price | Title Company |
|---|---|---|---|
| Santos Brenda | $285,000 | -- |
Source: Public Records
Mortgage History
| Date | Status | Borrower | Loan Amount |
|---|---|---|---|
| Open | Santos Brenda | $260,000 | |
| Previous Owner | Santos Brenda | $63,146 | |
| Previous Owner | Santos Brenda | $50,000 |
Source: Public Records
Tax History Compared to Growth
Tax History
| Year | Tax Paid | Tax Assessment Tax Assessment Total Assessment is a certain percentage of the fair market value that is determined by local assessors to be the total taxable value of land and additions on the property. | Land | Improvement |
|---|---|---|---|---|
| 2025 | $45 | $414,200 | $94,200 | $320,000 |
| 2024 | $4,195 | $367,700 | $89,800 | $277,900 |
| 2023 | $4,033 | $336,100 | $81,100 | $255,000 |
| 2022 | $4,065 | $306,300 | $76,700 | $229,600 |
| 2021 | $2,401 | $295,300 | $76,700 | $218,600 |
| 2020 | $5,868 | $295,300 | $76,700 | $218,600 |
| 2019 | $3,789 | $267,200 | $67,900 | $199,300 |
| 2018 | $1,617 | $253,600 | $67,900 | $185,700 |
| 2017 | $3,518 | $243,600 | $67,900 | $175,700 |
| 2016 | $3,431 | $236,100 | $67,900 | $168,200 |
| 2015 | $3,372 | $236,100 | $67,900 | $168,200 |
Source: Public Records
Map
Nearby Homes