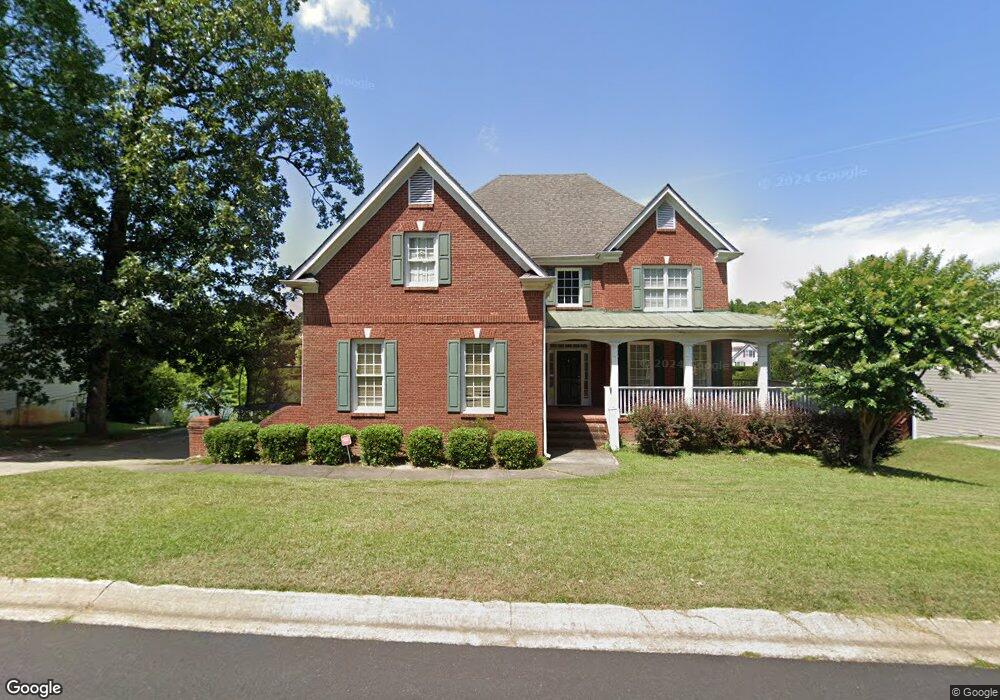
185 S Shore Terrace Unit 185 Fayetteville, GA 30214
Estimated Value: $431,129 - $467,000
3
Beds
3
Baths
2,593
Sq Ft
$173/Sq Ft
Est. Value
About This Home
This home is located at 185 S Shore Terrace Unit 185, Fayetteville, GA 30214 and is currently estimated at $449,532, approximately $173 per square foot. 185 S Shore Terrace Unit 185 is a home located in Fayette County with nearby schools including Bennett's Mill Middle School, Fayette County High School, and Rising Star Montessori School.
Ownership History
Date
Name
Owned For
Owner Type
Purchase Details
Closed on
Mar 26, 2010
Sold by
Sherrit Kyle
Bought by
Sherrit Kyle and Sherrit Elizabeth A
Current Estimated Value
Home Financials for this Owner
Home Financials are based on the most recent Mortgage that was taken out on this home.
Original Mortgage
$205,214
Outstanding Balance
$140,021
Interest Rate
5.5%
Mortgage Type
FHA
Estimated Equity
$309,511
Purchase Details
Closed on
Feb 8, 2008
Sold by
Dolby Ellen L
Bought by
Forum Design Inc
Purchase Details
Closed on
Nov 1, 2001
Sold by
Valentine Matthew W and Valentine Jennifer M
Bought by
Looney Orlasbders N
Purchase Details
Closed on
Aug 27, 1998
Sold by
Jim Dutton Homes
Bought by
Valentine Matthew and Valentine Jennifer
Home Financials for this Owner
Home Financials are based on the most recent Mortgage that was taken out on this home.
Original Mortgage
$205,650
Interest Rate
6.99%
Mortgage Type
New Conventional
Create a Home Valuation Report for This Property
The Home Valuation Report is an in-depth analysis detailing your home's value as well as a comparison with similar homes in the area
Home Values in the Area
Average Home Value in this Area
Purchase History
| Date | Buyer | Sale Price | Title Company |
|---|---|---|---|
| Sherrit Kyle | -- | -- | |
| Sherrit Kyle | $209,000 | -- | |
| Forum Design Inc | $217,500 | -- | |
| Looney Orlasbders N | $232,500 | -- | |
| Valentine Matthew | $228,500 | -- |
Source: Public Records
Mortgage History
| Date | Status | Borrower | Loan Amount |
|---|---|---|---|
| Open | Sherrit Kyle | $205,214 | |
| Previous Owner | Valentine Matthew | $205,650 |
Source: Public Records
Tax History Compared to Growth
Tax History
| Year | Tax Paid | Tax Assessment Tax Assessment Total Assessment is a certain percentage of the fair market value that is determined by local assessors to be the total taxable value of land and additions on the property. | Land | Improvement |
|---|---|---|---|---|
| 2024 | $3,380 | $160,236 | $26,000 | $134,236 |
| 2023 | $2,707 | $138,880 | $26,000 | $112,880 |
| 2022 | $3,123 | $134,240 | $26,000 | $108,240 |
| 2021 | $2,903 | $115,520 | $26,000 | $89,520 |
| 2020 | $3,270 | $107,800 | $18,000 | $89,800 |
| 2019 | $3,169 | $103,520 | $18,000 | $85,520 |
| 2018 | $2,517 | $81,800 | $400 | $81,400 |
| 2017 | $2,344 | $80,560 | $400 | $80,160 |
| 2016 | $1,825 | $61,920 | $400 | $61,520 |
| 2015 | $2,214 | $73,400 | $18,000 | $55,400 |
| 2014 | $2,059 | $67,240 | $18,000 | $49,240 |
| 2013 | -- | $62,120 | $0 | $0 |
Source: Public Records
Map
Nearby Homes
- 225 S Shore Terrace
- 585 Huddleston Rd
- 230 White Rd
- Columbia Plan at Arborvale
- Oak Park Plan at Arborvale
- Esquire Place Plan at Arborvale
- Cumberland Plan at Arborvale
- Lehigh Plan at Arborvale
- 560 Hawthorne Dr
- 215 Creekside Trail
- 140 Biltmore Dr
- 205 Sycamore Bend
- E OF 118 Stanley Rd
- 145 Heritage Way
- 115 Westside Way
- 110 Birch Ct
- 120 Birch Ct
- 160 Winona Dr
- 150 Rolison Way
- 235 Rolison Way
- 185 South Shore Terrace
- 175 South Shore Terrace
- 195 South Shore Terrace
- 165 South Shore Terrace
- 140 South Shore Terrace
- 150 South Shore Terrace
- 150 S Shore Terrace
- 0 S Shore Terrace Unit 8615483
- 0 S Shore Terrace
- 275 Heritage Lake Dr
- 285 Heritage Lake Dr
- 205 South Shore Terrace
- 265 Heritage Lake Dr
- 160 S Shore Terrace
- 160 South Shore Terrace
- 155 South Shore Terrace
- 155 S Shore Terrace
- 255 Heritage Lake Dr
- 215 South Shore Terrace
- 295 Heritage Lake Dr