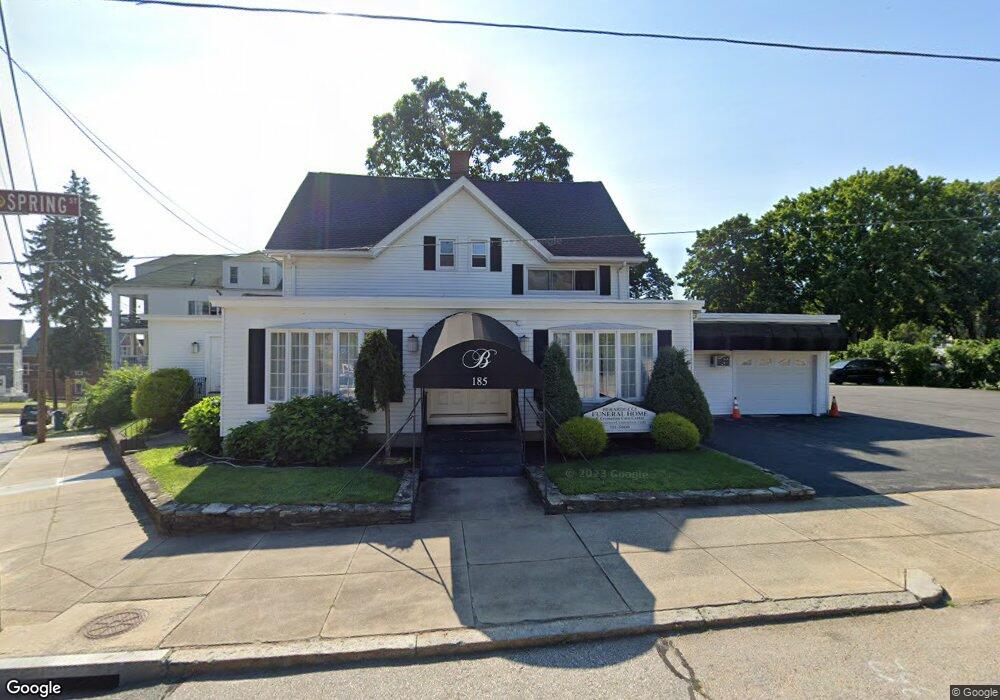
185 Spring St Woonsocket, RI 02895
North End NeighborhoodEstimated Value: $472,319
Studio
3
Baths
2,592
Sq Ft
$182/Sq Ft
Est. Value
About This Home
This home is located at 185 Spring St, Woonsocket, RI 02895 and is currently estimated at $472,319, approximately $182 per square foot. 185 Spring St is a home located in Providence County with nearby schools including Woonsocket High School, Rise Prep Mayoral Academy Middle School, and Rise Prep Mayoral Academy.
Ownership History
Date
Name
Owned For
Owner Type
Purchase Details
Closed on
May 6, 2016
Sold by
Berarducci Annette M
Bought by
4Th Generations Llc
Current Estimated Value
Purchase Details
Closed on
Apr 23, 2014
Sold by
185 Spring St Realty
Bought by
Berarducci Aneete M
Purchase Details
Closed on
May 10, 2005
Sold by
Linton 3Rd John E and Mahoney Phyllis A
Bought by
Lauzon Todd W and Lauzon Christina K
Home Financials for this Owner
Home Financials are based on the most recent Mortgage that was taken out on this home.
Original Mortgage
$306,000
Interest Rate
6.01%
Mortgage Type
Commercial
Create a Home Valuation Report for This Property
The Home Valuation Report is an in-depth analysis detailing your home's value as well as a comparison with similar homes in the area
Home Values in the Area
Average Home Value in this Area
Purchase History
| Date | Buyer | Sale Price | Title Company |
|---|---|---|---|
| 4Th Generations Llc | -- | -- | |
| Berarducci Aneete M | $190,000 | -- | |
| Lauzon Todd W | $375,000 | -- |
Source: Public Records
Mortgage History
| Date | Status | Borrower | Loan Amount |
|---|---|---|---|
| Previous Owner | Lauzon Todd W | $306,000 | |
| Previous Owner | Lauzon Todd W | $10,000 |
Source: Public Records
Tax History
| Year | Tax Paid | Tax Assessment Tax Assessment Total Assessment is a certain percentage of the fair market value that is determined by local assessors to be the total taxable value of land and additions on the property. | Land | Improvement |
|---|---|---|---|---|
| 2025 | $3,042 | $270,900 | $113,500 | $157,400 |
| 2024 | -- | $257,600 | $113,500 | $144,100 |
| 2023 | $0 | $257,600 | $113,500 | $144,100 |
| 2022 | $0 | $257,600 | $113,500 | $144,100 |
| 2021 | $0 | $221,300 | $62,900 | $158,400 |
| 2020 | $0 | $221,300 | $62,900 | $158,400 |
| 2018 | $0 | $221,300 | $62,900 | $158,400 |
| 2017 | $0 | $193,700 | $66,800 | $126,900 |
| 2016 | -- | $193,700 | $66,800 | $126,900 |
| 2015 | -- | $193,700 | $66,800 | $126,900 |
| 2014 | -- | $230,800 | $73,400 | $157,400 |
Source: Public Records
Map
Nearby Homes
- 164 W School St
- 187 Boyden St
- 83 Summer St
- 107 Blackstone St
- 0 N Main St Unit 1401765
- 481 N Main St
- 130 E School St
- 154 156 Winter St
- 115 Railroad St
- 308 Harris Ave
- 550 Winter St
- 458 Prospect St
- 542 Prospect St
- 36 Fairmount St
- 180 Allen St Unit 104
- 99 Allen St Unit 205
- 35 Greene St
- 60 Fairlawn Ave
- 42 Elbow St
- 60 Rathbun St
- 175 Spring St
- 88 Prospect St
- 152 W School St
- 159 Spring St
- 74 Prospect St
- 143 Spring St
- 101 Prospect St
- 138 W School St
- 156 W School St
- 154 W School St
- 68 Propsect St
- 85 Prospect St
- 126 W School St
- 126R W School St
- 126 W School (Rear) St
- 68 Prospect St
- 129 Spring St
- 121 Prospect St
- 170 Spring St
- 131 Spring St
Your Personal Tour Guide
Ask me questions while you tour the home.