Estimated Value: $186,000 - $193,732
3
Beds
1
Bath
1,368
Sq Ft
$139/Sq Ft
Est. Value
About This Home
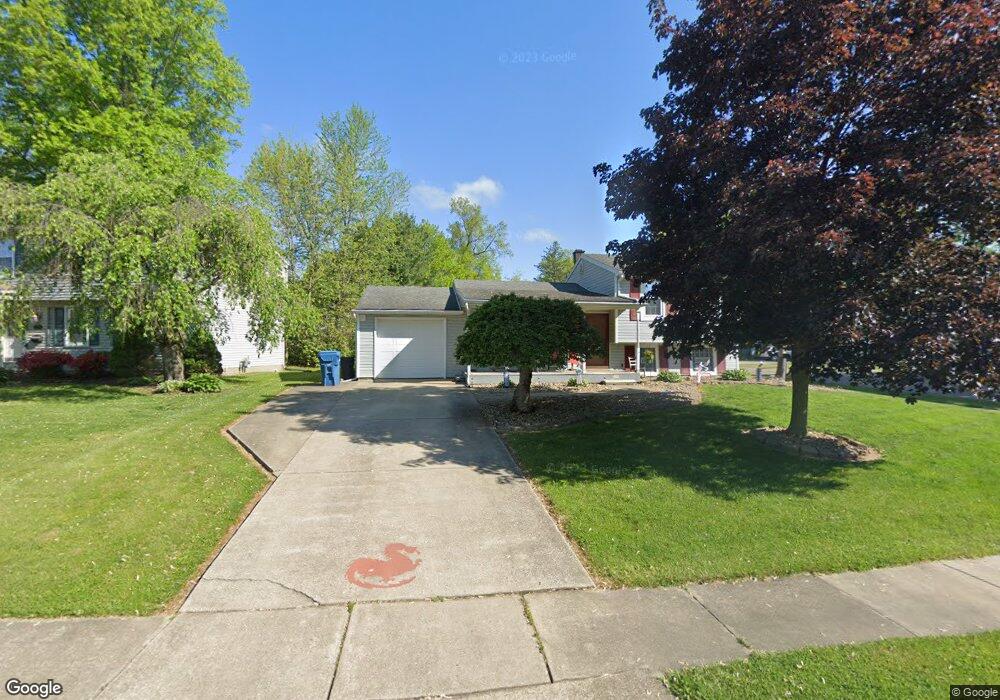
This home is located at 185 Summerberry Ln, Niles, OH 44446 and is currently estimated at $190,683, approximately $139 per square foot. 185 Summerberry Ln is a home located in Trumbull County with nearby schools including Howland High School, Summit Academy Community School - Warren, and Niles Preparatory Academy.
Ownership History
Date
Name
Owned For
Owner Type
Purchase Details
Closed on
Jun 19, 2008
Sold by
Sky Bank
Bought by
Jones David M and Cottrell Allison L
Current Estimated Value
Home Financials for this Owner
Home Financials are based on the most recent Mortgage that was taken out on this home.
Original Mortgage
$83,686
Outstanding Balance
$54,923
Interest Rate
6.5%
Mortgage Type
FHA
Estimated Equity
$135,760
Purchase Details
Closed on
May 24, 2001
Sold by
Hall Darrell Gean
Bought by
Garcia Henry P and Garcia Sonya
Purchase Details
Closed on
May 5, 1997
Sold by
Knight Ellen Jo
Bought by
Hall Darrell Gean
Home Financials for this Owner
Home Financials are based on the most recent Mortgage that was taken out on this home.
Original Mortgage
$67,965
Interest Rate
8.05%
Purchase Details
Closed on
Jan 1, 1990
Bought by
Phyllis J Knight
Create a Home Valuation Report for This Property
The Home Valuation Report is an in-depth analysis detailing your home's value as well as a comparison with similar homes in the area
Home Values in the Area
Average Home Value in this Area
Purchase History
| Date | Buyer | Sale Price | Title Company |
|---|---|---|---|
| Jones David M | $85,000 | Attorney | |
| Garcia Henry P | $100,000 | -- | |
| Hall Darrell Gean | $68,000 | -- | |
| Phyllis J Knight | -- | -- |
Source: Public Records
Mortgage History
| Date | Status | Borrower | Loan Amount |
|---|---|---|---|
| Open | Jones David M | $83,686 | |
| Previous Owner | Hall Darrell Gean | $67,965 | |
| Closed | Garcia Henry P | -- |
Source: Public Records
Tax History Compared to Growth
Tax History
| Year | Tax Paid | Tax Assessment Tax Assessment Total Assessment is a certain percentage of the fair market value that is determined by local assessors to be the total taxable value of land and additions on the property. | Land | Improvement |
|---|---|---|---|---|
| 2024 | $1,959 | $45,680 | $5,810 | $39,870 |
| 2023 | $1,959 | $45,680 | $5,810 | $39,870 |
| 2022 | $1,785 | $35,560 | $5,810 | $29,750 |
| 2021 | $1,875 | $35,560 | $5,810 | $29,750 |
| 2020 | $1,892 | $35,560 | $5,810 | $29,750 |
| 2019 | $1,771 | $31,680 | $5,810 | $25,870 |
| 2018 | $1,765 | $31,680 | $5,810 | $25,870 |
| 2017 | $1,756 | $31,680 | $5,810 | $25,870 |
| 2016 | $1,574 | $28,140 | $5,810 | $22,330 |
| 2015 | $1,557 | $28,140 | $5,810 | $22,330 |
| 2014 | $1,563 | $28,140 | $5,810 | $22,330 |
| 2013 | $1,557 | $29,580 | $5,810 | $23,770 |
Source: Public Records
Map
Nearby Homes
- 695 Trumbull Dr
- 164 Summerberry Ln
- 1529 Difford Dr
- 5375 East Dr
- 613 North Rd
- 47 Woodland Chase Blvd Unit 47
- 1411 Gypsy Ln
- 138 Mill Creek Rd
- 245 North Rd
- 1414 Niles Cortland Rd
- 820 Cynthia Ct
- 145 North Rd
- 0 Harrison St
- 3744 Valacamp Ave SE
- 5960 Mines Rd SE
- 1004 N Bentley Ave
- 57 Wilson Ave
- 4256 Youngstown Rd SE
- 0 Willow Creek Dr SE
- 1187 Deforest Rd SE
- 177 Summerberry Ln
- 169 Summerberry Ln
- 701 Trumbull Dr
- 180 Morningside Rd
- 163 Summerberry Ln
- 174 Morningside Rd
- 186 Summerberry Ln
- 689 Trumbull Dr
- 170 Summerberry Ln
- 190 Summerberry Ln
- 157 Summerberry Ln
- 709 Trumbull Dr
- 168 Morningside Rd
- 711 Trumbull Dr
- 683 Trumbull Dr
- 164 Morningside Rd
- 158 Summerberry Ln
- 149 Summerberry Ln
- 713 Trumbull Dr
- 677 Trumbull Dr