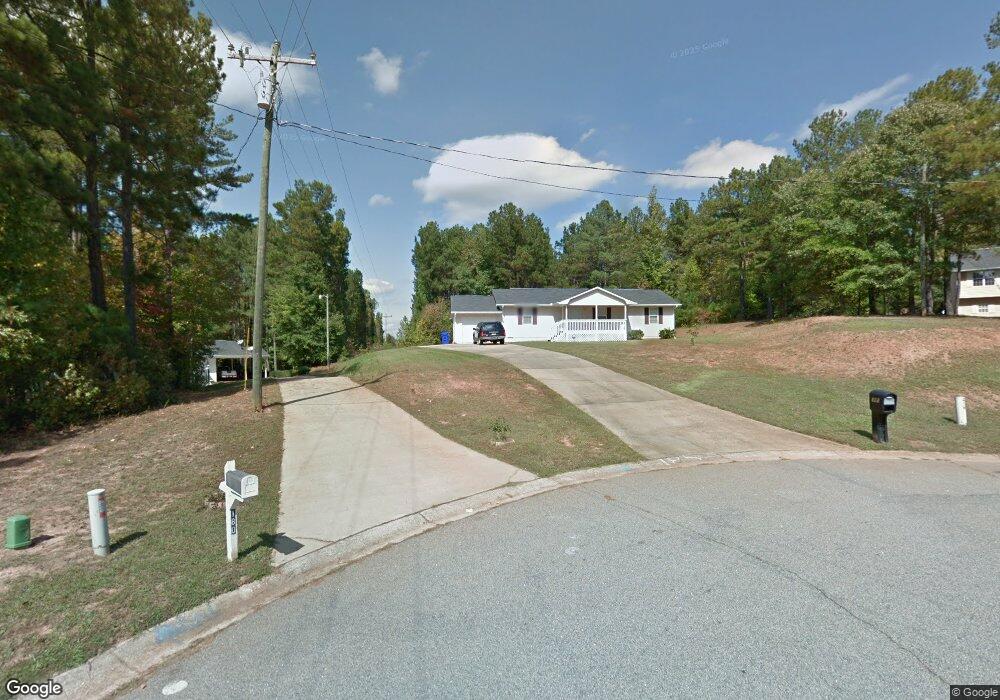
185 Teal Place Newnan, GA 30263
Estimated Value: $209,000 - $400,000
3
Beds
2
Baths
1,152
Sq Ft
$233/Sq Ft
Est. Value
About This Home
This home is located at 185 Teal Place, Newnan, GA 30263 and is currently estimated at $267,880, approximately $232 per square foot. 185 Teal Place is a home located in Coweta County with nearby schools including Atkinson Elementary School, Smokey Road Middle School, and Newnan High School.
Ownership History
Date
Name
Owned For
Owner Type
Purchase Details
Closed on
Apr 4, 2001
Sold by
Rio Const & Inv Inc
Bought by
Bohannon Kimberly D
Current Estimated Value
Home Financials for this Owner
Home Financials are based on the most recent Mortgage that was taken out on this home.
Original Mortgage
$88,511
Outstanding Balance
$32,556
Interest Rate
6.99%
Mortgage Type
FHA
Estimated Equity
$235,324
Purchase Details
Closed on
Mar 26, 2001
Sold by
Rio Construction & Investments
Bought by
Rio Construction & Investments Inc
Home Financials for this Owner
Home Financials are based on the most recent Mortgage that was taken out on this home.
Original Mortgage
$88,511
Outstanding Balance
$32,556
Interest Rate
6.99%
Mortgage Type
FHA
Estimated Equity
$235,324
Purchase Details
Closed on
Sep 29, 2000
Sold by
Mcdowell Dennis H
Bought by
Rio Construction & Investments Inc
Purchase Details
Closed on
Apr 7, 1989
Bought by
Mcdowell Dennis H
Create a Home Valuation Report for This Property
The Home Valuation Report is an in-depth analysis detailing your home's value as well as a comparison with similar homes in the area
Home Values in the Area
Average Home Value in this Area
Purchase History
| Date | Buyer | Sale Price | Title Company |
|---|---|---|---|
| Bohannon Kimberly D | $89,900 | -- | |
| Rio Construction & Investments Inc | -- | -- | |
| Rio Construction & Investments Inc | $45,000 | -- | |
| Mcdowell Dennis H | -- | -- |
Source: Public Records
Mortgage History
| Date | Status | Borrower | Loan Amount |
|---|---|---|---|
| Open | Bohannon Kimberly D | $88,511 |
Source: Public Records
Tax History Compared to Growth
Tax History
| Year | Tax Paid | Tax Assessment Tax Assessment Total Assessment is a certain percentage of the fair market value that is determined by local assessors to be the total taxable value of land and additions on the property. | Land | Improvement |
|---|---|---|---|---|
| 2024 | $1,726 | $74,360 | $20,000 | $54,360 |
| 2023 | $1,726 | $68,304 | $16,000 | $52,304 |
| 2022 | $1,510 | $61,309 | $16,000 | $45,309 |
| 2021 | $1,179 | $44,784 | $8,000 | $36,784 |
| 2020 | $1,187 | $44,784 | $8,000 | $36,784 |
| 2019 | $993 | $33,927 | $8,000 | $25,927 |
| 2018 | $995 | $33,927 | $8,000 | $25,927 |
| 2017 | $773 | $26,379 | $4,000 | $22,379 |
| 2016 | $669 | $23,104 | $4,000 | $19,104 |
| 2015 | $464 | $16,281 | $4,000 | $12,281 |
| 2014 | $384 | $13,607 | $4,000 | $9,607 |
Source: Public Records
Map
Nearby Homes
- 110 Corn Row Ct
- 135 Widgeon Dr
- 23 Corn Crib Dr
- 23 Corn Crib Ct
- 58 Bailey Dr
- 140 Beverly Park Ct
- 31 Festiva Dr
- 130 Mallard Dr
- 0 Meadowsweet Ln Unit 10582479
- 25 Bailey Dr
- 0 Smokey Rd Unit 10495165
- 75 Davis McLendon Way
- 0000 Smokey Rd
- 261 Lagrange St
- 1756 Millard Farmer Rd
- 713 Smokey Rd
- 623 Belk Rd
- 68 Timberland Trail
- 46 Brandish Dr
- 12 Plantation Dr
- 180 Teal Place
- 175 Teal Place
- 170 Teal Place
- 165 Teal Place
- 155 Teal Place
- 160 Teal Place
- 145 Teal Place
- 150 Teal Place
- 135 Teal Place
- 140 Teal Place
- 0 Teal Place Unit 7344251
- 0 Teal Place Unit 7335413
- 0 Teal Place Unit 7125128
- 0 Teal Place Unit 8634899
- 0 Teal Place Unit 8476927
- 0 Teal Place Unit 8474808
- 0 Teal Place Unit 8468807
- 0 Teal Place Unit 8868637
- 130 Teal Place
- 125 Teal Place