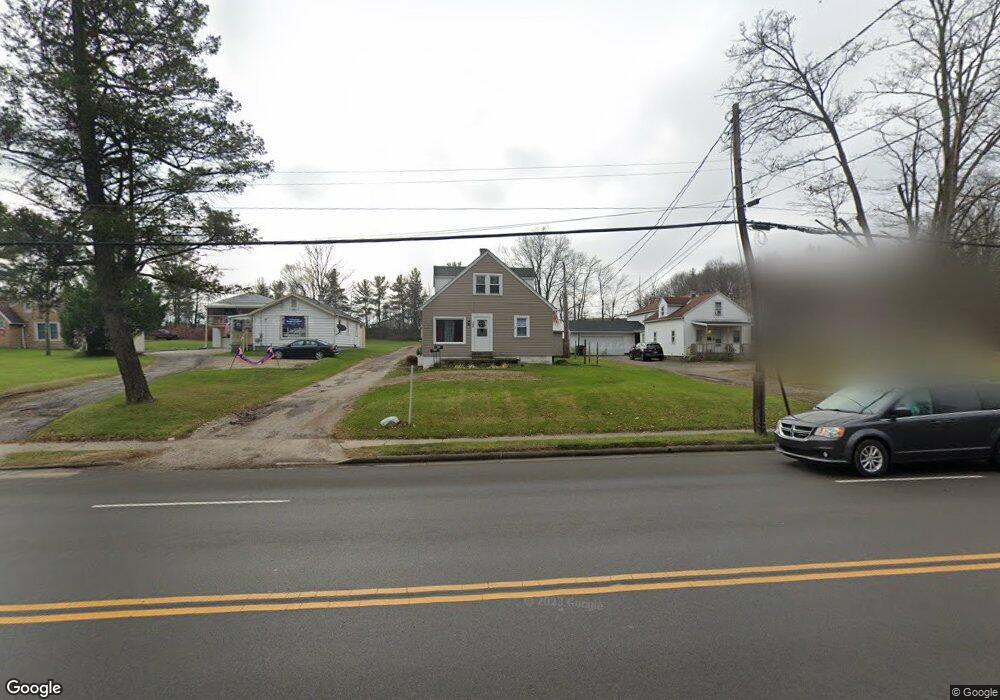
185 W Cook Rd Mansfield, OH 44907
Estimated Value: $121,954 - $152,000
3
Beds
1
Bath
1,290
Sq Ft
$104/Sq Ft
Est. Value
About This Home
This home is located at 185 W Cook Rd, Mansfield, OH 44907 and is currently estimated at $133,989, approximately $103 per square foot. 185 W Cook Rd is a home located in Richland County with nearby schools including Madison High School, St. Peter's Elementary/Montessori School, and St. Peter's High School/Junior High.
Ownership History
Date
Name
Owned For
Owner Type
Purchase Details
Closed on
Mar 3, 2021
Sold by
A & O Llc
Bought by
Synergy Property Solutions Inc
Current Estimated Value
Purchase Details
Closed on
Apr 30, 2019
Sold by
Massey Patricia A and Massey Patty A
Bought by
A & O Llc
Home Financials for this Owner
Home Financials are based on the most recent Mortgage that was taken out on this home.
Original Mortgage
$80,000
Interest Rate
4.3%
Mortgage Type
Commercial
Purchase Details
Closed on
Jan 10, 2007
Sold by
Dittrich Dennis R and Mazzeo Joan
Bought by
Massey Frank T and Massey Patty A
Create a Home Valuation Report for This Property
The Home Valuation Report is an in-depth analysis detailing your home's value as well as a comparison with similar homes in the area
Home Values in the Area
Average Home Value in this Area
Purchase History
| Date | Buyer | Sale Price | Title Company |
|---|---|---|---|
| Synergy Property Solutions Inc | $785,000 | Southern Title | |
| A & O Llc | $100,000 | None Available | |
| Massey Frank T | $70,000 | Southern Title |
Source: Public Records
Mortgage History
| Date | Status | Borrower | Loan Amount |
|---|---|---|---|
| Previous Owner | A & O Llc | $80,000 |
Source: Public Records
Tax History Compared to Growth
Tax History
| Year | Tax Paid | Tax Assessment Tax Assessment Total Assessment is a certain percentage of the fair market value that is determined by local assessors to be the total taxable value of land and additions on the property. | Land | Improvement |
|---|---|---|---|---|
| 2024 | $1,018 | $24,640 | $4,410 | $20,230 |
| 2023 | $1,018 | $24,640 | $4,410 | $20,230 |
| 2022 | $836 | $18,620 | $3,940 | $14,680 |
| 2021 | $836 | $18,620 | $3,940 | $14,680 |
| 2020 | $844 | $18,620 | $3,940 | $14,680 |
| 2019 | $793 | $15,800 | $3,340 | $12,460 |
| 2018 | $786 | $15,800 | $3,340 | $12,460 |
| 2017 | $551 | $15,800 | $3,340 | $12,460 |
| 2016 | $332 | $6,650 | $3,170 | $3,480 |
| 2015 | $332 | $6,650 | $3,170 | $3,480 |
| 2014 | $324 | $6,650 | $3,170 | $3,480 |
| 2012 | $160 | $7,000 | $3,340 | $3,660 |
Source: Public Records
Map
Nearby Homes
- 136 Elmridge Rd
- 33 Rambleside Dr
- 61 Ridgewood Blvd
- 1156 Yorkwood Rd
- 674 Hillgrove Ave
- 681 Hillgrove Ave
- 0 S Main St
- 181 Chilton Ave
- 0 Lexington Ave Unit 224009661
- 0 George Ave
- 1156 Briarwood Rd
- 421 Edgewood Rd
- 476 Glendale Blvd
- 501 Clifton Blvd
- 431 Overlook Rd
- 69 Reba Ave
- 844 Woodville Rd
- 189 Kinkel Ave
- 237 Willowbrook Dr
- 505 Wood St