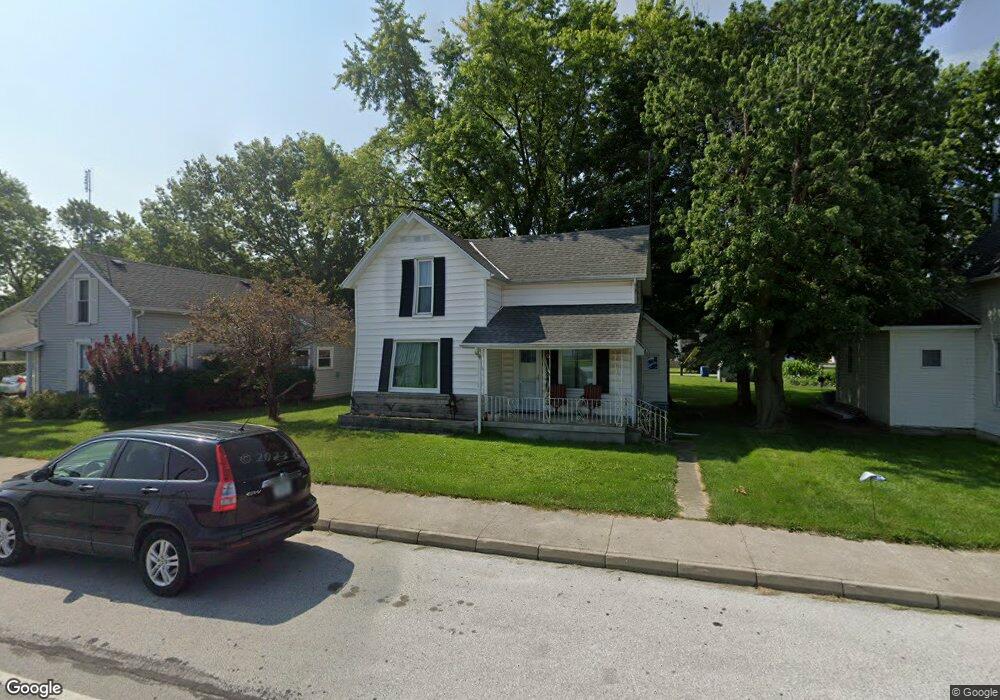
185 W Logan St Markle, IN 46770
Estimated Value: $111,000 - $142,000
2
Beds
1
Bath
1,397
Sq Ft
$91/Sq Ft
Est. Value
About This Home
This home is located at 185 W Logan St, Markle, IN 46770 and is currently estimated at $127,085, approximately $90 per square foot. 185 W Logan St is a home located in Huntington County with nearby schools including Salamonie School and Huntington North High School.
Ownership History
Date
Name
Owned For
Owner Type
Purchase Details
Closed on
Dec 30, 2009
Sold by
Wilson Joel E
Bought by
Wilson Garland L
Current Estimated Value
Home Financials for this Owner
Home Financials are based on the most recent Mortgage that was taken out on this home.
Original Mortgage
$44,500
Outstanding Balance
$28,728
Interest Rate
4.78%
Mortgage Type
Future Advance Clause Open End Mortgage
Estimated Equity
$98,357
Purchase Details
Closed on
Sep 7, 2009
Sold by
Wilson Tiffany Rose
Bought by
Wilson Joel Everett
Purchase Details
Closed on
Jan 7, 2005
Sold by
Wilson Garland L
Bought by
Wilson Joel E and Wilson Tiffany R
Home Financials for this Owner
Home Financials are based on the most recent Mortgage that was taken out on this home.
Original Mortgage
$0
Interest Rate
5.78%
Mortgage Type
Unknown
Create a Home Valuation Report for This Property
The Home Valuation Report is an in-depth analysis detailing your home's value as well as a comparison with similar homes in the area
Home Values in the Area
Average Home Value in this Area
Purchase History
| Date | Buyer | Sale Price | Title Company |
|---|---|---|---|
| Wilson Garland L | -- | None Available | |
| Wilson Joel Everett | -- | Shambaugh Kast Beck & Willia | |
| Wilson Joel E | -- | None Available |
Source: Public Records
Mortgage History
| Date | Status | Borrower | Loan Amount |
|---|---|---|---|
| Open | Wilson Garland L | $44,500 | |
| Closed | Wilson Joel E | $0 | |
| Closed | Wilson Joel E | $46,000 |
Source: Public Records
Tax History Compared to Growth
Tax History
| Year | Tax Paid | Tax Assessment Tax Assessment Total Assessment is a certain percentage of the fair market value that is determined by local assessors to be the total taxable value of land and additions on the property. | Land | Improvement |
|---|---|---|---|---|
| 2024 | $2,068 | $103,400 | $7,900 | $95,500 |
| 2023 | $1,816 | $90,800 | $7,900 | $82,900 |
| 2022 | $1,688 | $84,400 | $7,900 | $76,500 |
| 2021 | $1,438 | $71,900 | $7,900 | $64,000 |
| 2020 | $1,306 | $65,300 | $7,900 | $57,400 |
| 2019 | $1,216 | $60,800 | $7,900 | $52,900 |
| 2018 | $1,230 | $61,500 | $7,900 | $53,600 |
| 2017 | $1,208 | $60,400 | $7,900 | $52,500 |
| 2016 | $1,162 | $58,100 | $7,900 | $50,200 |
| 2014 | $1,114 | $55,700 | $7,900 | $47,800 |
| 2013 | $1,114 | $56,800 | $7,900 | $48,900 |
Source: Public Records
Map
Nearby Homes