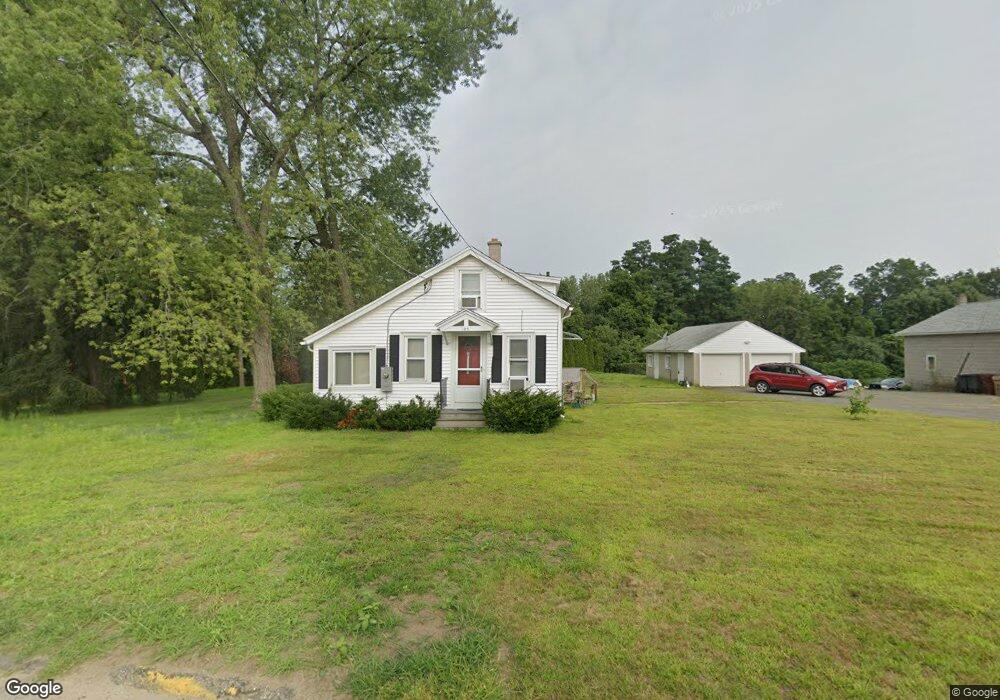
185 West St Unit 185 Ludlow, MA 01056
Estimated Value: $273,000 - $1,357,116
2
Beds
2
Baths
983
Sq Ft
$561/Sq Ft
Est. Value
About This Home
This home is located at 185 West St Unit 185, Ludlow, MA 01056 and is currently estimated at $551,279, approximately $560 per square foot. 185 West St Unit 185 is a home located in Hampden County with nearby schools including East Street Elementary School, Chapin Street Elementary School, and Paul R. Baird Middle School.
Ownership History
Date
Name
Owned For
Owner Type
Purchase Details
Closed on
Jun 27, 2025
Sold by
Partyka Partners Lp
Bought by
Laflamme Katharine J
Current Estimated Value
Purchase Details
Closed on
Dec 3, 2001
Sold by
Sevivas Augusto S Est and Sevivas
Bought by
Coelho Augusto A
Purchase Details
Closed on
Feb 26, 1999
Sold by
185 Dev Corp
Bought by
Sharif Mohammad
Purchase Details
Closed on
Nov 3, 1995
Sold by
Ludlow Sb
Bought by
Hampden Cnty Medi Grp
Purchase Details
Closed on
Aug 5, 1992
Sold by
Timely Prof Condo Lp
Bought by
Ludlow Sb
Create a Home Valuation Report for This Property
The Home Valuation Report is an in-depth analysis detailing your home's value as well as a comparison with similar homes in the area
Home Values in the Area
Average Home Value in this Area
Purchase History
| Date | Buyer | Sale Price | Title Company |
|---|---|---|---|
| Laflamme Katharine J | $280,000 | -- | |
| Laflamme Katharine J | $280,000 | -- | |
| Laflamme Katharine J | $280,000 | -- | |
| Laflamme Katharine J | $280,000 | -- | |
| Coelho Augusto A | $167,693 | -- | |
| Coelho Augusto A | $167,693 | -- | |
| Coelho Augusto A | $167,693 | -- | |
| Coelho Augusto A | $167,693 | -- | |
| Sharif Mohammad | $21,000 | -- | |
| Sharif Mohammad | $21,000 | -- | |
| Sharif Mohammad | $21,000 | -- | |
| Sharif Mohammad | $21,000 | -- | |
| Hampden Cnty Medi Grp | $90,000 | -- | |
| Hampden Cnty Medi Grp | $90,000 | -- | |
| Hampden Cnty Medi Grp | $90,000 | -- | |
| Hampden Cnty Medi Grp | $90,000 | -- | |
| Ludlow Sb | $250,000 | -- | |
| Sevivas Augusto S | $245,000 | -- | |
| Ludlow Sb | $250,000 | -- | |
| Ludlow Sb | $250,000 | -- | |
| Sevivas Augusto S | $245,000 | -- | |
| Ludlow Sb | $250,000 | -- |
Source: Public Records
Mortgage History
| Date | Status | Borrower | Loan Amount |
|---|---|---|---|
| Previous Owner | Ludlow Sb | $15,000 |
Source: Public Records
Tax History Compared to Growth
Tax History
| Year | Tax Paid | Tax Assessment Tax Assessment Total Assessment is a certain percentage of the fair market value that is determined by local assessors to be the total taxable value of land and additions on the property. | Land | Improvement |
|---|---|---|---|---|
| 2025 | $3,718 | $214,300 | $85,300 | $129,000 |
| 2024 | $3,638 | $201,100 | $85,300 | $115,800 |
| 2023 | $3,445 | $176,600 | $74,900 | $101,700 |
| 2022 | $3,502 | $175,200 | $83,000 | $92,200 |
| 2021 | $3,560 | $168,900 | $83,000 | $85,900 |
| 2020 | $3,415 | $165,600 | $81,700 | $83,900 |
| 2019 | $3,189 | $160,900 | $81,000 | $79,900 |
| 2018 | $3,013 | $158,500 | $81,000 | $77,500 |
| 2017 | $2,889 | $155,900 | $79,100 | $76,800 |
| 2016 | $2,749 | $151,600 | $77,400 | $74,200 |
| 2015 | $2,585 | $149,500 | $76,700 | $72,800 |
Source: Public Records
Map
Nearby Homes