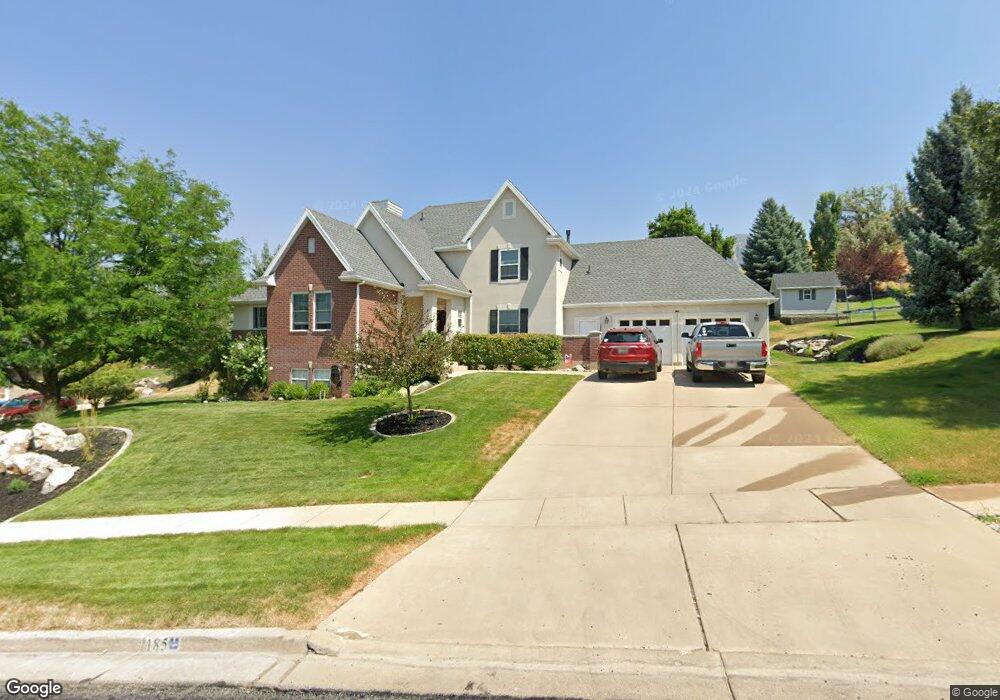
185 Winding Way Logan, UT 84321
Wilson NeighborhoodEstimated Value: $664,825 - $755,000
5
Beds
4
Baths
3,901
Sq Ft
$181/Sq Ft
Est. Value
About This Home
This home is located at 185 Winding Way, Logan, UT 84321 and is currently estimated at $707,956, approximately $181 per square foot. 185 Winding Way is a home located in Cache County with nearby schools including Wilson School, Mount Logan Middle School, and Logan High School.
Ownership History
Date
Name
Owned For
Owner Type
Purchase Details
Closed on
May 30, 2023
Sold by
Park Kyungsuk and Park Hyonyong
Bought by
Blotter Richard and Blotter Cynthia
Current Estimated Value
Home Financials for this Owner
Home Financials are based on the most recent Mortgage that was taken out on this home.
Original Mortgage
$492,000
Outstanding Balance
$477,792
Interest Rate
6.39%
Mortgage Type
New Conventional
Estimated Equity
$230,164
Purchase Details
Closed on
Apr 9, 2018
Sold by
Park Kyungsuk
Bought by
Park Kyungsuk and Lee Hyonyong
Purchase Details
Closed on
Apr 6, 2018
Sold by
Johns Daniel E and Johns Holly H
Bought by
Park Kyungsuk
Purchase Details
Closed on
Jul 12, 2010
Sold by
Justin Daniel F and Allen Justin Sandra
Bought by
Johns Daniel E and Johns Holly H
Home Financials for this Owner
Home Financials are based on the most recent Mortgage that was taken out on this home.
Original Mortgage
$224,900
Interest Rate
4.71%
Mortgage Type
New Conventional
Create a Home Valuation Report for This Property
The Home Valuation Report is an in-depth analysis detailing your home's value as well as a comparison with similar homes in the area
Home Values in the Area
Average Home Value in this Area
Purchase History
| Date | Buyer | Sale Price | Title Company |
|---|---|---|---|
| Blotter Richard | -- | Us Title | |
| Park Kyungsuk | -- | American Secure Title | |
| Park Kyungsuk | -- | American Secure Title | |
| Johns Daniel E | -- | Hickman Land Title Company |
Source: Public Records
Mortgage History
| Date | Status | Borrower | Loan Amount |
|---|---|---|---|
| Open | Blotter Richard | $492,000 | |
| Previous Owner | Johns Daniel E | $224,900 |
Source: Public Records
Tax History
| Year | Tax Paid | Tax Assessment Tax Assessment Total Assessment is a certain percentage of the fair market value that is determined by local assessors to be the total taxable value of land and additions on the property. | Land | Improvement |
|---|---|---|---|---|
| 2025 | $279 | $361,330 | $0 | $0 |
| 2024 | $2,768 | $346,750 | $0 | $0 |
| 2023 | $2,882 | $344,110 | $0 | $0 |
| 2022 | $3,086 | $344,110 | $0 | $0 |
| 2021 | $2,621 | $451,560 | $91,200 | $360,360 |
| 2020 | $2,559 | $396,698 | $91,200 | $305,498 |
| 2019 | $2,675 | $396,697 | $91,200 | $305,497 |
| 2018 | $2,635 | $356,850 | $91,200 | $265,650 |
| 2017 | $2,556 | $182,985 | $0 | $0 |
| 2016 | $2,650 | $177,485 | $0 | $0 |
| 2015 | $2,541 | $175,285 | $0 | $0 |
| 2014 | $1,993 | $152,125 | $0 | $0 |
| 2013 | -- | $152,125 | $0 | $0 |
Source: Public Records
Map
Nearby Homes
- 147 Winding Way Unit 50
- 1647 E Quail Canyon Dr
- 1374 E 260 N
- 1387 E 260 N
- 128 S 1170 E
- 1535 Sumac Dr
- 1147 Eastridge Dr
- 1034 Thrushwood Dr
- 1045 Fox Farm Rd
- 74 Canterbury Cir
- 1164 E Mountain Rd
- 1374 Maple Dr
- 28 River Pointe Dr
- 825 N 1400 E
- 70 River Pointe Dr
- 866 Hillcrest Ave
- 2758 N Canyon Cove Dr
- 2738 N Canyon Cove Dr
- 720 E 525 N Unit 32
- 676 N 275 E Unit 614
- 173 Winding Way
- 197 Winding Way
- 194 Winding Way
- 172 Winding Way
- 209 Winding Way
- 202 Winding Way
- 160 Winding Way
- 211 Winding Way
- 210 Winding Way
- 1569 Braxton Place
- 1557 Braxton Place
- 1583 Braxton Place
- 148 Winding Way
- 1545 Braxton Place
- 223 Winding Way
- 226 Winding Way
- 135 Winding Way Unit 48
- 122 N Winding Way
- 122 Winding Way
- 1574 Braxton Place
Your Personal Tour Guide
Ask me questions while you tour the home.