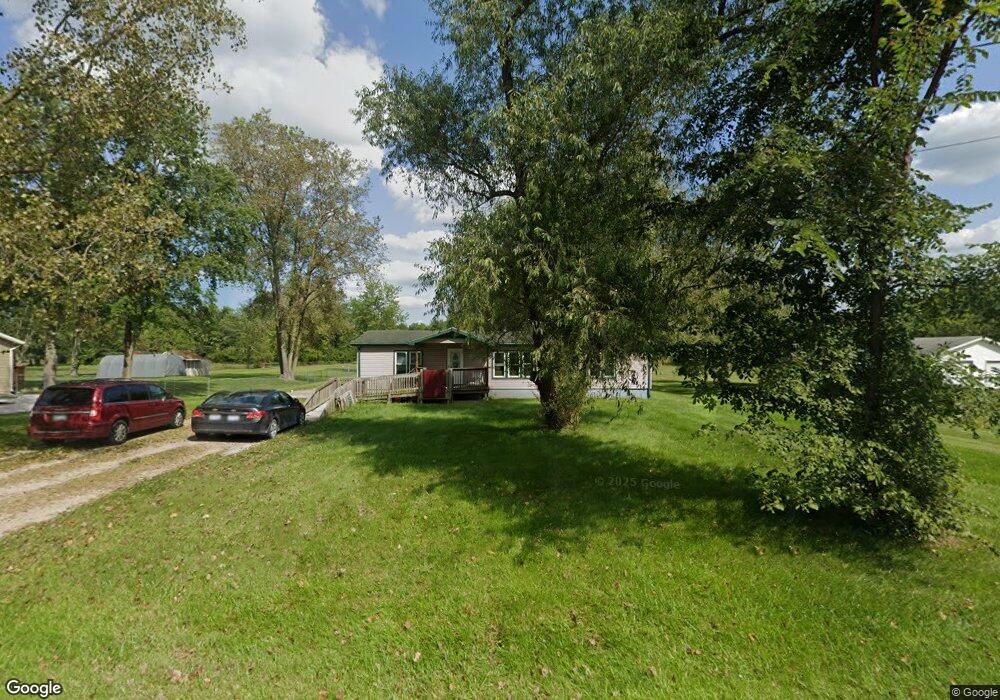
1850 Allen Rd Kimball, MI 48074
Estimated Value: $199,104 - $238,000
3
Beds
1
Bath
1,562
Sq Ft
$142/Sq Ft
Est. Value
About This Home
This home is located at 1850 Allen Rd, Kimball, MI 48074 and is currently estimated at $221,776, approximately $141 per square foot. 1850 Allen Rd is a home located in St. Clair County with nearby schools including Kimball Elementary School, Central Middle School, and Port Huron High School.
Ownership History
Date
Name
Owned For
Owner Type
Purchase Details
Closed on
Dec 10, 2020
Sold by
Miller Paul D
Bought by
Miller Paul D and Rock Elizabeth A
Current Estimated Value
Purchase Details
Closed on
Jan 2, 2017
Sold by
Miller Paul D
Bought by
Miller Paul D and Paul D Miller Revocable Trust
Purchase Details
Closed on
Nov 2, 2015
Sold by
Wright Kyle C
Bought by
Wynkoop Heather and Wynkoop Erik
Home Financials for this Owner
Home Financials are based on the most recent Mortgage that was taken out on this home.
Original Mortgage
$120,308
Outstanding Balance
$94,494
Interest Rate
3.91%
Mortgage Type
New Conventional
Estimated Equity
$127,282
Purchase Details
Closed on
Aug 13, 2009
Sold by
Miller Denise C
Bought by
Miller Paul D
Create a Home Valuation Report for This Property
The Home Valuation Report is an in-depth analysis detailing your home's value as well as a comparison with similar homes in the area
Home Values in the Area
Average Home Value in this Area
Purchase History
| Date | Buyer | Sale Price | Title Company |
|---|---|---|---|
| Miller Paul D | -- | None Available | |
| Miller Paul D | -- | None Available | |
| Miller Paul D | -- | None Available | |
| Wynkoop Heather | $117,000 | -- | |
| Miller Paul D | -- | None Available |
Source: Public Records
Mortgage History
| Date | Status | Borrower | Loan Amount |
|---|---|---|---|
| Open | Wynkoop Heather | $120,308 |
Source: Public Records
Tax History Compared to Growth
Tax History
| Year | Tax Paid | Tax Assessment Tax Assessment Total Assessment is a certain percentage of the fair market value that is determined by local assessors to be the total taxable value of land and additions on the property. | Land | Improvement |
|---|---|---|---|---|
| 2025 | $1,530 | $91,100 | $0 | $0 |
| 2024 | $807 | $84,000 | $0 | $0 |
| 2023 | $739 | $81,100 | $0 | $0 |
| 2022 | $1,367 | $66,800 | $0 | $0 |
| 2021 | $1,287 | $63,200 | $0 | $0 |
| 2020 | $1,287 | $62,700 | $62,700 | $0 |
| 2019 | $1,268 | $58,200 | $0 | $0 |
| 2018 | $1,201 | $52,300 | $0 | $0 |
| 2017 | $1,172 | $52,300 | $0 | $0 |
| 2016 | $598 | $52,300 | $0 | $0 |
| 2015 | -- | $50,600 | $50,600 | $0 |
| 2014 | -- | $42,000 | $42,000 | $0 |
| 2013 | -- | $52,500 | $0 | $0 |
Source: Public Records
Map
Nearby Homes
- V/L Allen
- 1979 Allen Rd
- 1701 Allen Rd
- 1830 Leland Rd
- 1604 Allen Rd
- 4632 Cloverdale Ln
- 00 Howard Rd
- 4595 Griswold Rd
- 0 Allen Rd Unit 20250008597
- 0 Allen Rd Unit 20250008612
- 1405 Range Rd
- 0000 Range Rd
- 5510 Griswold Rd
- 00 Range Rd
- 1876 Morningstar Ave
- 1091 Allen Rd
- 0 Lapeer Rd Unit 50137357
- 0 Wall Rd Unit 50185999
- 0 Wadhams Rd Unit 50155021
- 2007 Edward Ln E
- 1842 Allen Rd
- 1868 Allen Rd
- 1845 Allen Rd
- 1880 Allen Rd
- 1832 Allen Rd
- 1859 Allen Rd
- 1876 Allen Rd
- 1893 Allen Rd
- 1835 Allen Rd
- 1871 Allen Rd
- 1886 Allen Rd
- 1895 Allen Rd Unit 1895
- 1895 Allen Rd Unit 1897 Allen Road
- 1895 Allen Rd Unit 1899 A B 1901 1903
- 1894 Allen Rd
- 1818 Allen Rd
- 1901 Allen Rd Unit 1903
- 1904 Allen Rd
- 1811 Allen Rd
- 1806 Allen Rd