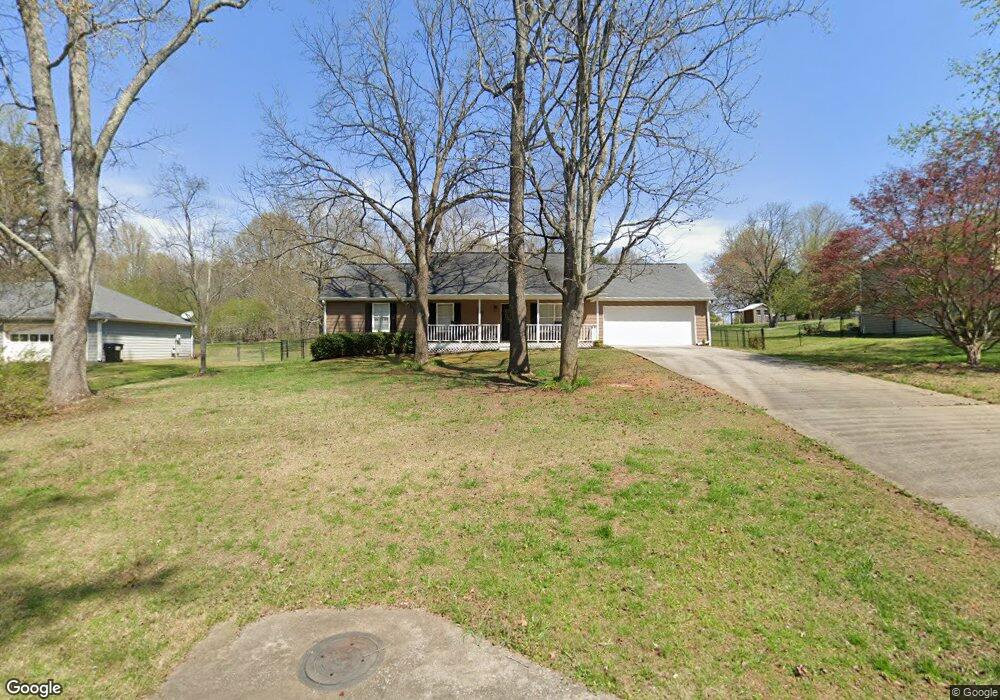
1850 Chadwick Dr Cumming, GA 30028
Estimated Value: $356,304 - $375,000
3
Beds
2
Baths
1,470
Sq Ft
$251/Sq Ft
Est. Value
About This Home
This home is located at 1850 Chadwick Dr, Cumming, GA 30028 and is currently estimated at $368,826, approximately $250 per square foot. 1850 Chadwick Dr is a home located in Forsyth County with nearby schools including Sawnee Elementary School, Otwell Middle School, and Forsyth Central High School.
Ownership History
Date
Name
Owned For
Owner Type
Purchase Details
Closed on
Mar 25, 2010
Sold by
Federal Natl Mtg Assn Fnma
Bought by
Hayes Heather L
Current Estimated Value
Home Financials for this Owner
Home Financials are based on the most recent Mortgage that was taken out on this home.
Original Mortgage
$151,020
Outstanding Balance
$99,843
Interest Rate
4.93%
Mortgage Type
New Conventional
Estimated Equity
$268,983
Purchase Details
Closed on
Aug 4, 2009
Sold by
Guaranty Bank
Bought by
Federal National Mortgage Association
Purchase Details
Closed on
Oct 5, 2001
Sold by
Icon Real Estate Ventures Llc
Bought by
Pennington Warren H
Home Financials for this Owner
Home Financials are based on the most recent Mortgage that was taken out on this home.
Original Mortgage
$125,686
Interest Rate
6.89%
Mortgage Type
New Conventional
Purchase Details
Closed on
Apr 28, 2001
Sold by
Ayotte Gaylord A
Bought by
Puyallup Property Trust
Create a Home Valuation Report for This Property
The Home Valuation Report is an in-depth analysis detailing your home's value as well as a comparison with similar homes in the area
Home Values in the Area
Average Home Value in this Area
Purchase History
| Date | Buyer | Sale Price | Title Company |
|---|---|---|---|
| Hayes Heather L | -- | -- | |
| Federal National Mortgage Association | -- | -- | |
| Guaranty Bk | $126,387 | -- | |
| Pennington Warren H | $114,000 | -- | |
| Puyallup Property Trust | -- | -- |
Source: Public Records
Mortgage History
| Date | Status | Borrower | Loan Amount |
|---|---|---|---|
| Open | Hayes Heather L | $151,020 | |
| Previous Owner | Pennington Warren H | $125,686 |
Source: Public Records
Tax History Compared to Growth
Tax History
| Year | Tax Paid | Tax Assessment Tax Assessment Total Assessment is a certain percentage of the fair market value that is determined by local assessors to be the total taxable value of land and additions on the property. | Land | Improvement |
|---|---|---|---|---|
| 2025 | $2,770 | $133,236 | $50,000 | $83,236 |
| 2024 | $2,770 | $140,752 | $48,000 | $92,752 |
| 2023 | $2,284 | $133,544 | $40,000 | $93,544 |
| 2022 | $2,226 | $88,872 | $28,000 | $60,872 |
| 2021 | $2,159 | $88,872 | $28,000 | $60,872 |
| 2020 | $2,067 | $84,420 | $24,000 | $60,420 |
| 2019 | $1,987 | $80,404 | $22,000 | $58,404 |
| 2018 | $1,690 | $65,792 | $22,000 | $43,792 |
| 2017 | $1,664 | $64,228 | $22,000 | $42,228 |
| 2016 | $1,664 | $64,228 | $22,000 | $42,228 |
| 2015 | $1,531 | $58,228 | $18,000 | $40,228 |
| 2014 | $1,367 | $54,936 | $0 | $0 |
Source: Public Records
Map
Nearby Homes
- 1565 Dr Bramblett Rd
- 1735 Gordon Rd
- 5340 Memento Trace
- 2795 Roper Rd
- 2165 Robin Hood Trail
- 4900 Spot Rd
- 2275 Doctor Bramblett Rd
- 2615 Yellowstone Farm Dr
- 2725 Yellowstone Farm Dr
- 1210 Magnolia Park Cir
- 2755 Marie Way
- 2765 Marie Way
- 2775 Marie Way
- 2610 Misty Hollow Ln
- 1009 Canton Hwy
- 1850 Overlook Springs Ln
- 2545 Little John Ln
- 3115 Corsair Curve
- 1860 Chadwick Dr
- 1840 Chadwick Dr
- 1870 Chadwick Dr
- 1870 Chadwick Dr
- 1830 Chadwick Dr
- 1855 Chadwick Dr
- 1820 Chadwick Dr
- 1880 Chadwick Dr
- 1880 Chadwick Dr Unit 8
- 1845 Chadwick Dr
- 1865 Chadwick Dr
- 1835 Chadwick Dr
- 1810 Chadwick Dr
- 1825 Chadwick Dr
- 1910 Bramblett Place
- 1715 Dr Bramblett Rd
- 1890 Chadwick Dr
- 1735 Dr Bramblett Rd
- 1815 Chadwick Dr
- 1955 Buice Ct