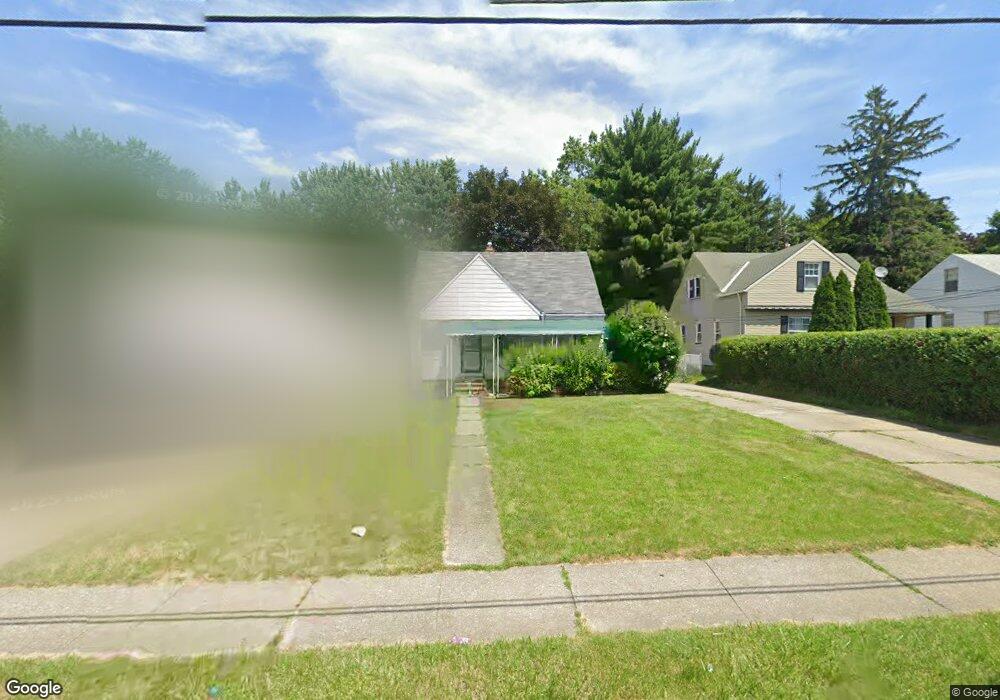
18501 Libby Rd Maple Heights, OH 44137
Estimated Value: $132,000 - $158,000
3
Beds
2
Baths
725
Sq Ft
$199/Sq Ft
Est. Value
About This Home
This home is located at 18501 Libby Rd, Maple Heights, OH 44137 and is currently estimated at $144,478, approximately $199 per square foot. 18501 Libby Rd is a home located in Cuyahoga County with nearby schools including Abraham Lincoln Elementary School, Rockside/ J.F. Kennedy School, and Barack Obama School.
Ownership History
Date
Name
Owned For
Owner Type
Purchase Details
Closed on
Mar 2, 2022
Sold by
Baker Timothy C and Baker Beverly J
Bought by
Clark Rachel C
Current Estimated Value
Home Financials for this Owner
Home Financials are based on the most recent Mortgage that was taken out on this home.
Original Mortgage
$122,244
Outstanding Balance
$112,635
Interest Rate
3.69%
Mortgage Type
FHA
Estimated Equity
$31,843
Purchase Details
Closed on
Mar 11, 2005
Sold by
Smartmarket Investments Llc
Bought by
Baker Timothy C
Purchase Details
Closed on
Oct 12, 2004
Sold by
The Bank Of New York
Bought by
Smartmarket Investments Llc
Home Financials for this Owner
Home Financials are based on the most recent Mortgage that was taken out on this home.
Original Mortgage
$73,318
Interest Rate
5.8%
Mortgage Type
Purchase Money Mortgage
Purchase Details
Closed on
May 13, 2004
Sold by
Brown Oscar L and Brown Carmen
Bought by
The Bank Of New York
Purchase Details
Closed on
Nov 18, 1999
Sold by
C E G O Inc
Bought by
Brown Oscar L
Home Financials for this Owner
Home Financials are based on the most recent Mortgage that was taken out on this home.
Original Mortgage
$81,598
Interest Rate
7.88%
Mortgage Type
Stand Alone First
Purchase Details
Closed on
Mar 25, 1999
Sold by
Hud
Bought by
C E G O Inc
Home Financials for this Owner
Home Financials are based on the most recent Mortgage that was taken out on this home.
Original Mortgage
$300,000
Interest Rate
7.17%
Purchase Details
Closed on
Dec 14, 1998
Sold by
Clark Michael J and Clark Nancy L
Bought by
Hud
Purchase Details
Closed on
Aug 15, 1994
Sold by
Verner James R
Bought by
Clark Michael J and Clark Nancy L
Home Financials for this Owner
Home Financials are based on the most recent Mortgage that was taken out on this home.
Original Mortgage
$54,959
Interest Rate
8.62%
Mortgage Type
FHA
Purchase Details
Closed on
Oct 26, 1992
Sold by
Verner James R
Bought by
Verner James R
Purchase Details
Closed on
Dec 5, 1990
Sold by
Verner James R
Bought by
Verner James R
Purchase Details
Closed on
Apr 14, 1988
Sold by
Verner James R and Verner Johanna
Bought by
Verner James R
Purchase Details
Closed on
Jan 1, 1975
Bought by
Verner James R and Verner Johanna
Create a Home Valuation Report for This Property
The Home Valuation Report is an in-depth analysis detailing your home's value as well as a comparison with similar homes in the area
Home Values in the Area
Average Home Value in this Area
Purchase History
| Date | Buyer | Sale Price | Title Company |
|---|---|---|---|
| Clark Rachel C | $124,500 | Jeffery S Watson Law Firm Ltd | |
| Baker Timothy C | -- | -- | |
| Smartmarket Investments Llc | $63,900 | Accutitle | |
| The Bank Of New York | $60,000 | Ohio Title Corp | |
| Brown Oscar L | $96,000 | Guardian Title | |
| C E G O Inc | -- | Gateway Title Agency Inc | |
| Hud | $52,000 | -- | |
| Clark Michael J | $55,000 | -- | |
| Verner James R | -- | -- | |
| Verner James R | -- | -- | |
| Verner James R | -- | -- | |
| Verner James R | -- | -- |
Source: Public Records
Mortgage History
| Date | Status | Borrower | Loan Amount |
|---|---|---|---|
| Open | Clark Rachel C | $122,244 | |
| Previous Owner | Smartmarket Investments Llc | $73,318 | |
| Previous Owner | Brown Oscar L | $81,598 | |
| Previous Owner | C E G O Inc | $300,000 | |
| Previous Owner | Clark Michael J | $54,959 | |
| Closed | Brown Oscar L | $14,400 |
Source: Public Records
Tax History
| Year | Tax Paid | Tax Assessment Tax Assessment Total Assessment is a certain percentage of the fair market value that is determined by local assessors to be the total taxable value of land and additions on the property. | Land | Improvement |
|---|---|---|---|---|
| 2025 | $5,030 | $43,575 | $7,210 | $36,365 |
| 2024 | $4,582 | $43,575 | $7,210 | $36,365 |
| 2023 | $2,428 | $22,470 | $4,900 | $17,570 |
| 2022 | $2,471 | $22,470 | $4,900 | $17,570 |
| 2021 | $2,634 | $22,470 | $4,900 | $17,570 |
| 2020 | $2,252 | $17,010 | $3,710 | $13,300 |
| 2019 | $2,239 | $48,600 | $10,600 | $38,000 |
| 2018 | $2,227 | $17,010 | $3,710 | $13,300 |
| 2017 | $2,421 | $18,380 | $3,430 | $14,950 |
| 2016 | $2,341 | $18,380 | $3,430 | $14,950 |
| 2015 | $2,351 | $18,380 | $3,430 | $14,950 |
| 2014 | $2,351 | $20,200 | $3,780 | $16,420 |
Source: Public Records
Map
Nearby Homes
- 5234 Erwin St
- 18715 Libby Rd
- 5341 Hollywood Ave
- 18909 Maple Heights Blvd
- 5408 Oakwood Ave
- 5177 Cato St
- 5150 Arch St
- 5127 Erwin St
- 5194 Homewood Ave
- 5231 Philip Ave
- 18217 Edinboro Ave
- 5100 Erwin St
- 18840 Nitra Ave
- 5246 Philip Ave
- 17409 Mapleboro Ave
- 18990 Raymond St
- 18851 Raymond St
- 5165 Camden Rd
- 19520 Maple Heights Blvd
- 19289 Stafford Ave
- 18505 Libby Rd
- 18417 Libby Rd
- 18413 Libby Rd
- 18509 Libby Rd
- 18409 Libby Rd
- 18513 Libby Rd
- 18601 Harlan Dr
- 5255 Erwin St
- 5251 Erwin St
- 18405 Libby Rd Unit 4
- 18405 Libby Rd Unit 3
- 18405 Libby Rd Unit 2
- 18405 Libby Rd Unit 5
- 18405 Libby Rd Unit 1
- 18405 Libby Rd
- 18605 Harlan Dr
- 18500 Libby Rd
- 5249 Erwin St
- 18420 Libby Rd
- 18609 Harlan Dr
Your Personal Tour Guide
Ask me questions while you tour the home.