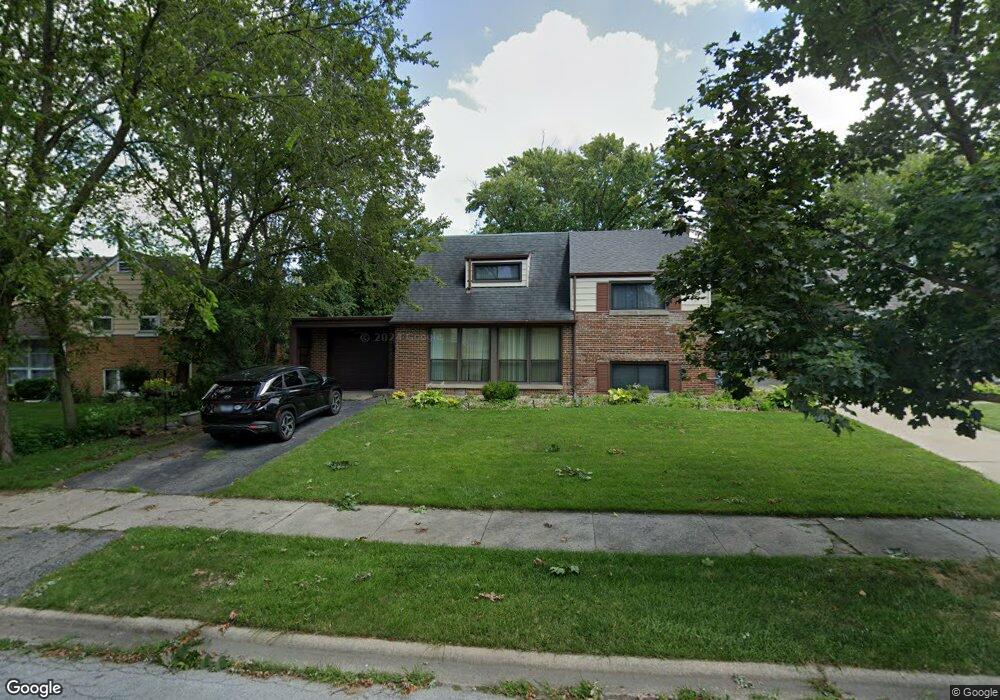
18505 Clyde Rd Homewood, IL 60430
Estimated Value: $222,447 - $253,000
3
Beds
2
Baths
938
Sq Ft
$252/Sq Ft
Est. Value
About This Home
This home is located at 18505 Clyde Rd, Homewood, IL 60430 and is currently estimated at $236,362, approximately $251 per square foot. 18505 Clyde Rd is a home located in Cook County with nearby schools including Western Avenue Elementary School, Parker Junior High School, and Homewood-Flossmoor High School.
Ownership History
Date
Name
Owned For
Owner Type
Purchase Details
Closed on
Jun 27, 2007
Sold by
Bergan Daniel J and Blaeser Jennifer
Bought by
Losby James A and Medina Losby Alicia R
Current Estimated Value
Home Financials for this Owner
Home Financials are based on the most recent Mortgage that was taken out on this home.
Original Mortgage
$190,400
Outstanding Balance
$118,196
Interest Rate
6.37%
Mortgage Type
New Conventional
Estimated Equity
$118,166
Purchase Details
Closed on
Feb 5, 1996
Sold by
Carberry John R and Carberry Lisa M
Bought by
Bergan Daniel J and Blaeser Jennifer
Home Financials for this Owner
Home Financials are based on the most recent Mortgage that was taken out on this home.
Original Mortgage
$135,481
Interest Rate
7.07%
Mortgage Type
FHA
Create a Home Valuation Report for This Property
The Home Valuation Report is an in-depth analysis detailing your home's value as well as a comparison with similar homes in the area
Home Values in the Area
Average Home Value in this Area
Purchase History
| Date | Buyer | Sale Price | Title Company |
|---|---|---|---|
| Losby James A | $238,000 | Git | |
| Bergan Daniel J | $138,000 | Attorneys Natl Title Network |
Source: Public Records
Mortgage History
| Date | Status | Borrower | Loan Amount |
|---|---|---|---|
| Open | Losby James A | $190,400 | |
| Previous Owner | Bergan Daniel J | $135,481 |
Source: Public Records
Tax History Compared to Growth
Tax History
| Year | Tax Paid | Tax Assessment Tax Assessment Total Assessment is a certain percentage of the fair market value that is determined by local assessors to be the total taxable value of land and additions on the property. | Land | Improvement |
|---|---|---|---|---|
| 2024 | $5,166 | $16,800 | $4,278 | $12,522 |
| 2023 | $5,817 | $16,800 | $4,278 | $12,522 |
| 2022 | $5,817 | $15,273 | $3,720 | $11,553 |
| 2021 | $5,860 | $15,272 | $3,720 | $11,552 |
| 2020 | $5,728 | $15,272 | $3,720 | $11,552 |
| 2019 | $3,921 | $11,380 | $3,348 | $8,032 |
| 2018 | $3,815 | $11,380 | $3,348 | $8,032 |
| 2017 | $3,775 | $11,380 | $3,348 | $8,032 |
| 2016 | $4,151 | $11,006 | $2,976 | $8,030 |
| 2015 | $4,101 | $11,006 | $2,976 | $8,030 |
| 2014 | $4,044 | $11,006 | $2,976 | $8,030 |
| 2013 | $4,156 | $12,097 | $2,976 | $9,121 |
Source: Public Records
Map
Nearby Homes
- 18530 Stedhall Rd
- 2619 Alexander St
- 18509 Stedhall Rd
- 18450 Stedhall Rd
- 18418 Clyde Rd
- 18400 Cherry Creek Dr Unit 105
- 2807 Willow Rd Unit 103
- 710 Bruce Ave
- 625 Perth Ave
- 18340 Cherry Creek Dr Unit 7
- 18330 Perth Ave
- 802 Argyle Ave
- 18314 Dundee Ave
- 18210 Perth Ave
- 846 Park Dr
- 18157 Rockwell Ave
- 3007 Monterey Dr
- 3013 Carmel Dr
- 18310 Robin Ln Unit D2
- 18302 Robin Ln Unit D1
- 18509 Clyde Rd
- 18463 Clyde Rd
- 18513 Clyde Rd
- 18508 Stedhall Rd
- 18502 Stedhall Rd
- 18516 Stedhall Rd
- 18453 Clyde Rd
- 18519 Clyde Rd
- 18502 Clyde Rd
- 18460 Clyde Rd
- 18522 Stedhall Rd
- 18454 Clyde Rd
- 18512 Clyde Rd
- 18523 Clyde Rd
- 18450 Clyde Rd
- 18536 Stedhall Rd
- 18516 Clyde Rd
- 18444 Clyde Rd
- 18503 Stedhall Rd
- 18540 Stedhall Rd