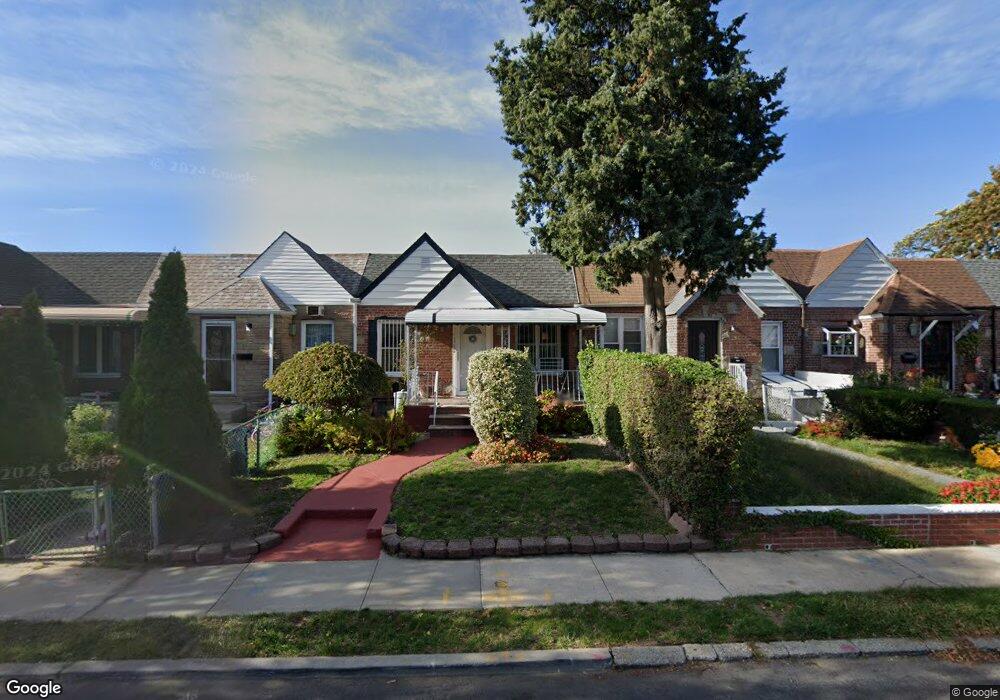
18505 Dunlop Ave Saint Albans, NY 11412
Hollis NeighborhoodEstimated Value: $513,054 - $653,000
--
Bed
--
Bath
968
Sq Ft
$599/Sq Ft
Est. Value
About This Home
This home is located at 18505 Dunlop Ave, Saint Albans, NY 11412 and is currently estimated at $579,764, approximately $598 per square foot. 18505 Dunlop Ave is a home located in Queens County with nearby schools including P.S. 118 Lorraine Hansberry, I.S. 192 The Linden, and True Deliverance Christian School.
Ownership History
Date
Name
Owned For
Owner Type
Purchase Details
Closed on
Sep 28, 1998
Sold by
Murren Keith M and Murren Rhona J Hernandez
Bought by
Hastings Green Marilyn A
Current Estimated Value
Home Financials for this Owner
Home Financials are based on the most recent Mortgage that was taken out on this home.
Original Mortgage
$116,850
Interest Rate
6.65%
Purchase Details
Closed on
Jul 19, 1995
Sold by
Bowers Lillie and Neely Daisy R
Bought by
Murren Keith M and Murren Rhona J Hernandez
Home Financials for this Owner
Home Financials are based on the most recent Mortgage that was taken out on this home.
Original Mortgage
$109,100
Interest Rate
7.61%
Mortgage Type
FHA
Purchase Details
Closed on
Mar 15, 1995
Sold by
Cherry Nimrod and Cherry Gloria
Bought by
Bowers Lillie and Neely Daisy R
Home Financials for this Owner
Home Financials are based on the most recent Mortgage that was taken out on this home.
Original Mortgage
$56,237
Interest Rate
8.78%
Mortgage Type
FHA
Create a Home Valuation Report for This Property
The Home Valuation Report is an in-depth analysis detailing your home's value as well as a comparison with similar homes in the area
Home Values in the Area
Average Home Value in this Area
Purchase History
| Date | Buyer | Sale Price | Title Company |
|---|---|---|---|
| Hastings Green Marilyn A | $123,000 | Stewart Title Insurance Co | |
| Murren Keith M | $275,000 | Lawyers Title Insurance Corp | |
| Bowers Lillie | $60,000 | Commonwealth Land Title Ins |
Source: Public Records
Mortgage History
| Date | Status | Borrower | Loan Amount |
|---|---|---|---|
| Previous Owner | Hastings Green Marilyn A | $116,850 | |
| Previous Owner | Murren Keith M | $109,100 | |
| Previous Owner | Bowers Lillie | $56,237 |
Source: Public Records
Tax History Compared to Growth
Tax History
| Year | Tax Paid | Tax Assessment Tax Assessment Total Assessment is a certain percentage of the fair market value that is determined by local assessors to be the total taxable value of land and additions on the property. | Land | Improvement |
|---|---|---|---|---|
| 2025 | $4,596 | $25,740 | $8,156 | $17,584 |
| 2024 | $2,413 | $24,283 | $7,867 | $16,416 |
| 2023 | $4,380 | $23,208 | $7,081 | $16,127 |
| 2022 | $4,150 | $32,340 | $10,380 | $21,960 |
| 2021 | $4,312 | $26,820 | $10,380 | $16,440 |
| 2020 | $4,244 | $24,300 | $10,380 | $13,920 |
| 2019 | $3,940 | $24,480 | $10,380 | $14,100 |
| 2018 | $3,645 | $19,340 | $9,841 | $9,499 |
| 2017 | $3,420 | $18,247 | $9,150 | $9,097 |
| 2016 | $3,338 | $18,247 | $9,150 | $9,097 |
| 2015 | $1,856 | $17,875 | $9,977 | $7,898 |
| 2014 | $1,856 | $16,864 | $11,165 | $5,699 |
Source: Public Records
Map
Nearby Homes
- 183-67 Dunlop Ave
- 187-23 Brinkerhoff Ave
- 183-09 Dunlop Ave
- 183-29 Brinkerhoff Ave
- 183-12 Elmira Ave
- 104-11 188th St
- 183-34 Fonda Ave
- 102-35 187th St
- 186-16 Hilburn Ave
- 102-13 183rd Place
- 10533 Farmers Blvd
- 19027 109th Rd
- 188-31 Jordan Ave
- 10211 187th St
- 184-15 Henderson Ave
- 185-05 Henderson Ave
- 10220 189th St
- 111-06 Farmers Blvd
- 187-44 Jordan Ave
- 10532 192nd St
- 18507 Dunlop Ave
- 18503 Dunlop Ave
- 18509 Dunlop Ave
- 18501 Dunlop Ave
- 185-09 Dunlop Ave Unit 1
- 185-09 Dunlop Ave
- 185-09 Dunlop Ave Unit 1st Fl
- 18511 Dunlop Ave
- 18369 Dunlop Ave
- 185-11 Dunlop Ave
- 185-07 Dunlop Ave
- 18515 Dunlop Ave
- 18515 Dunlop Ave
- 18367 Dunlop Ave
- 18368 Camden Ave
- 18372 Camden Ave
- 18517 Dunlop Ave
- 18364 Camden Ave
- 183-72 Camden Ave
- 185-17 Dunlop Ave