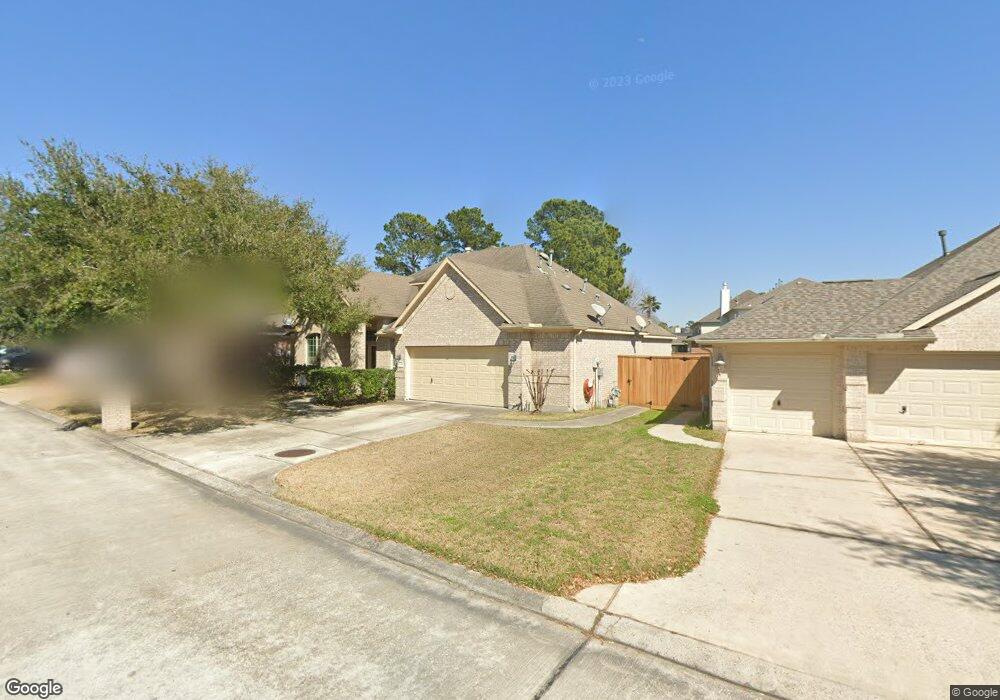
18506 Rustic Oar Way Humble, TX 77346
Lake Houston NeighborhoodEstimated Value: $367,983 - $402,000
3
Beds
3
Baths
3,263
Sq Ft
$116/Sq Ft
Est. Value
About This Home
This home is located at 18506 Rustic Oar Way, Humble, TX 77346 and is currently estimated at $378,496, approximately $115 per square foot. 18506 Rustic Oar Way is a home located in Harris County with nearby schools including Maplebrook Elementary School, Atascocita Middle School, and Atascocita High School.
Ownership History
Date
Name
Owned For
Owner Type
Purchase Details
Closed on
Aug 8, 2016
Sold by
Robles Henry and Robles Veronica
Bought by
Vanvleck Matthew C and Van Vleck Nicole C
Current Estimated Value
Home Financials for this Owner
Home Financials are based on the most recent Mortgage that was taken out on this home.
Original Mortgage
$213,750
Outstanding Balance
$170,987
Interest Rate
3.56%
Mortgage Type
New Conventional
Estimated Equity
$207,509
Purchase Details
Closed on
Apr 26, 2006
Sold by
Legacy/Monterey Homes Lp
Bought by
Robles Henry and Robles Veronica
Home Financials for this Owner
Home Financials are based on the most recent Mortgage that was taken out on this home.
Original Mortgage
$130,489
Interest Rate
6.32%
Mortgage Type
Fannie Mae Freddie Mac
Purchase Details
Closed on
Nov 14, 2005
Sold by
Lake Houston Walden Lp
Bought by
Legacy/Monterey Homes Lp
Create a Home Valuation Report for This Property
The Home Valuation Report is an in-depth analysis detailing your home's value as well as a comparison with similar homes in the area
Home Values in the Area
Average Home Value in this Area
Purchase History
| Date | Buyer | Sale Price | Title Company |
|---|---|---|---|
| Vanvleck Matthew C | -- | Stewart Title | |
| Robles Henry | -- | Mth Title Company | |
| Legacy/Monterey Homes Lp | -- | Mth Title Company Lc |
Source: Public Records
Mortgage History
| Date | Status | Borrower | Loan Amount |
|---|---|---|---|
| Open | Vanvleck Matthew C | $213,750 | |
| Previous Owner | Robles Henry | $130,489 |
Source: Public Records
Tax History Compared to Growth
Tax History
| Year | Tax Paid | Tax Assessment Tax Assessment Total Assessment is a certain percentage of the fair market value that is determined by local assessors to be the total taxable value of land and additions on the property. | Land | Improvement |
|---|---|---|---|---|
| 2025 | $7,193 | $367,515 | $79,077 | $288,438 |
| 2024 | $7,193 | $380,198 | $79,077 | $301,121 |
| 2023 | $7,193 | $413,084 | $53,331 | $359,753 |
| 2022 | $8,047 | $355,106 | $38,619 | $316,487 |
| 2021 | $7,691 | $297,121 | $38,619 | $258,502 |
| 2020 | $7,380 | $276,605 | $38,619 | $237,986 |
| 2019 | $6,965 | $267,379 | $38,619 | $228,760 |
| 2018 | $3,040 | $225,000 | $38,619 | $186,381 |
| 2017 | $6,286 | $225,000 | $38,619 | $186,381 |
| 2016 | $6,855 | $245,346 | $38,619 | $206,727 |
| 2015 | $5,556 | $236,431 | $38,619 | $197,812 |
| 2014 | $5,556 | $216,273 | $38,619 | $177,654 |
Source: Public Records
Map
Nearby Homes
- 18506 Skippers Helm
- 18515 Kyack Ct
- 19222 Aquatic Dr
- 19314 Aquatic Dr
- 18203 Octavio Frias Trail
- 8719 Rolling Rapids Rd
- 18218 Humber River Ln
- 18902 Aquatic Dr
- 7526 Bella Springs Dr
- 18715 Rusty Anchor Ct
- 18806 Rusty Anchor Ct
- 8602 Malardcrest Dr
- 18010 Ponte Vecchio Way
- 18006 Ponte Vecchio Way
- 8511 Silver Lure Dr
- 8518 Rialto Canal Loop
- 18211 Langkawi Ln
- 8826 Cross Country Dr
- 8431 Silver Lure Dr
- 8506 Malardcrest Dr
- 18510 Rustic Oar Way
- 18502 Rustic Oar Way
- 8923 Sailing Dr
- 18514 Rustic Oar Way
- 18507 Red Sails Pass
- 18511 Rustic Oar Way
- 18507 Rustic Oar Way
- 8931 Sailing Dr
- 18515 Rustic Oar Way
- 18503 Rustic Oar Way
- 18518 Rustic Oar Way
- 8918 Sailing Dr
- 8914 Sailing Dr
- 18519 Rustic Oar Way
- 8922 Sailing Dr
- 9003 Sailing Dr
- 8910 Sailing Dr
- 18515 Red Sails Pass
- 18510 Timber Shores Ln
- 18506 Timber Shores Ln