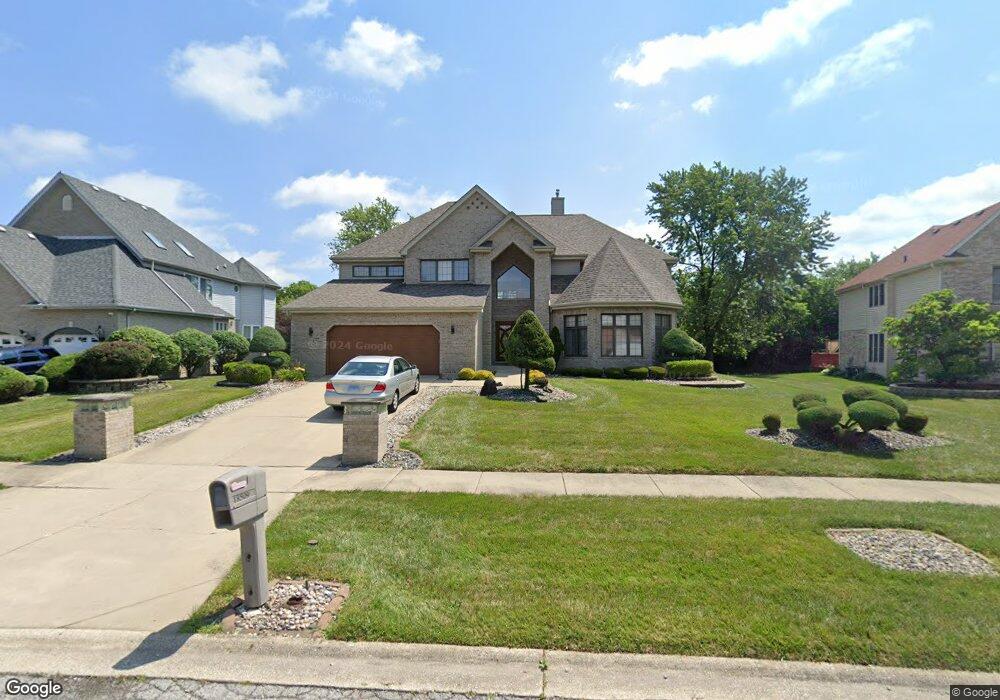
18509 River Rd Hazel Crest, IL 60429
Village West NeighborhoodEstimated Value: $177,000 - $222,000
4
Beds
2
Baths
1,885
Sq Ft
$104/Sq Ft
Est. Value
About This Home
This home is located at 18509 River Rd, Hazel Crest, IL 60429 and is currently estimated at $196,540, approximately $104 per square foot. 18509 River Rd is a home located in Cook County with nearby schools including Flossmoor Hills Elementary School, Parker Junior High School, and Homewood-Flossmoor High School.
Ownership History
Date
Name
Owned For
Owner Type
Purchase Details
Closed on
Jun 12, 2006
Sold by
Akintunde Haki
Bought by
Coleman Cubie L
Current Estimated Value
Home Financials for this Owner
Home Financials are based on the most recent Mortgage that was taken out on this home.
Original Mortgage
$124,925
Interest Rate
9%
Mortgage Type
Unknown
Purchase Details
Closed on
Jul 22, 2004
Sold by
Summers Ellen and Walker Tara
Bought by
Akintunde Haki
Home Financials for this Owner
Home Financials are based on the most recent Mortgage that was taken out on this home.
Original Mortgage
$99,000
Interest Rate
7.5%
Mortgage Type
Adjustable Rate Mortgage/ARM
Purchase Details
Closed on
Mar 29, 1996
Sold by
Mallette Shirley
Bought by
Summers Ellen and Walker Tara
Home Financials for this Owner
Home Financials are based on the most recent Mortgage that was taken out on this home.
Original Mortgage
$79,700
Interest Rate
7.36%
Mortgage Type
FHA
Create a Home Valuation Report for This Property
The Home Valuation Report is an in-depth analysis detailing your home's value as well as a comparison with similar homes in the area
Home Values in the Area
Average Home Value in this Area
Purchase History
| Date | Buyer | Sale Price | Title Company |
|---|---|---|---|
| Coleman Cubie L | $131,500 | Attorneys Title Guaranty Fun | |
| Akintunde Haki | $110,000 | Law | |
| Summers Ellen | $80,000 | -- |
Source: Public Records
Mortgage History
| Date | Status | Borrower | Loan Amount |
|---|---|---|---|
| Previous Owner | Coleman Cubie L | $124,925 | |
| Previous Owner | Akintunde Haki | $99,000 | |
| Previous Owner | Summers Ellen | $79,700 |
Source: Public Records
Tax History
| Year | Tax Paid | Tax Assessment Tax Assessment Total Assessment is a certain percentage of the fair market value that is determined by local assessors to be the total taxable value of land and additions on the property. | Land | Improvement |
|---|---|---|---|---|
| 2025 | $8,652 | $14,000 | $2,015 | $11,985 |
| 2024 | $8,652 | $14,000 | $2,015 | $11,985 |
| 2023 | $7,474 | $14,000 | $2,015 | $11,985 |
| 2022 | $7,474 | $8,888 | $1,705 | $7,183 |
| 2021 | $7,179 | $8,888 | $1,705 | $7,183 |
| 2020 | $7,304 | $8,888 | $1,705 | $7,183 |
| 2019 | $7,698 | $9,855 | $1,550 | $8,305 |
| 2018 | $7,473 | $9,855 | $1,550 | $8,305 |
| 2017 | $7,189 | $9,855 | $1,550 | $8,305 |
| 2016 | $6,316 | $9,507 | $1,395 | $8,112 |
| 2015 | $5,888 | $9,507 | $1,395 | $8,112 |
| 2014 | $5,850 | $9,507 | $1,395 | $8,112 |
| 2013 | $6,597 | $10,776 | $1,395 | $9,381 |
Source: Public Records
Map
Nearby Homes
- 18600 Village West Dr Unit 310
- 18600 Village West Dr Unit 303
- 3710 Briar Ln
- 3800 River Rd
- 754 Central Park Ave
- 3902 Edgewater Dr
- 3600 183rd St
- 3641 Beech St
- 3712 Beech St
- 3360 184th St Unit 3W
- 3360 184th St Unit 1E
- 3314 185th Place
- 835 Maple Rd
- 4445 Provincetown Dr
- 4036 W 187th St
- 18424 Kedzie Ave Unit 2A
- 3207 184th St Unit 1A
- 173 Williamsburg Rd Unit 1
- 18018 Chantilly Ln Unit S3
- 18840 Harding Ave
- 18509 River Rd
- 18507 River Rd
- 18511 River Rd
- 18505 River Rd
- 18513 River Rd
- 18505 Alexis Ct Unit 4
- 18504 River Rd
- 18503 River Rd
- 3604 River Rd
- 18500 River Rd
- 18501 Alexis Ct
- 18501 River Rd Unit 4
- 3603 River Rd
- 18607 Emily Ct Unit 28
- 18605 Emily Ct Unit 27
- 18604 Emily Ct Unit 22
- 18603 Emily Ct Unit 26
- 18414 River Rd
- 3606 River Rd
Your Personal Tour Guide
Ask me questions while you tour the home.