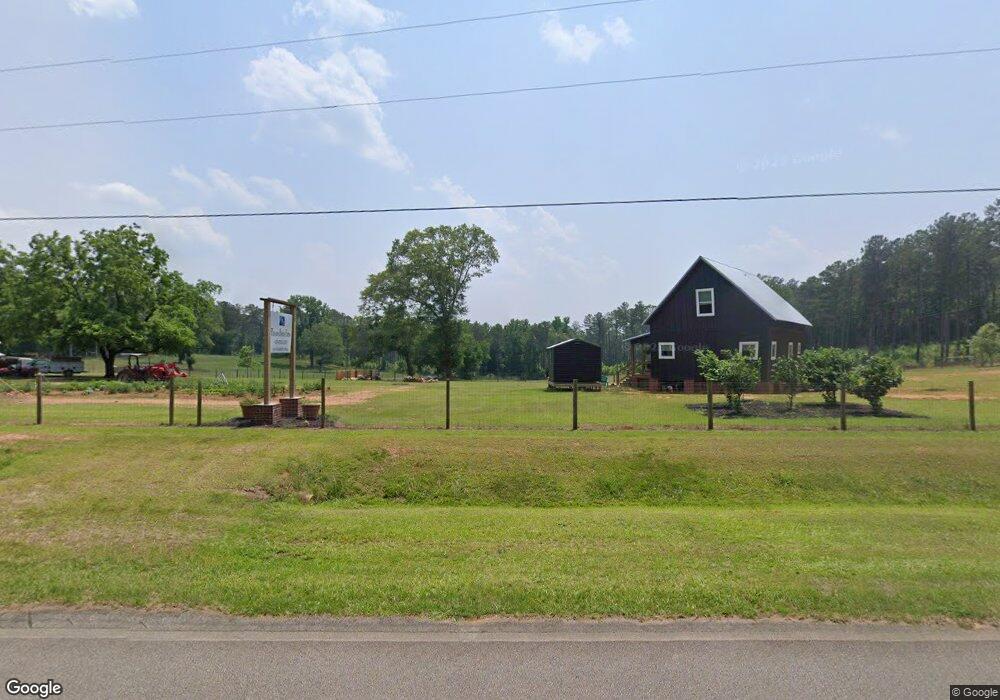
1851 Beaver Dam Rd Madison, GA 30650
Estimated Value: $28,691 - $207,000
--
Bed
1
Bath
915
Sq Ft
$135/Sq Ft
Est. Value
About This Home
This home is located at 1851 Beaver Dam Rd, Madison, GA 30650 and is currently estimated at $123,564, approximately $135 per square foot. 1851 Beaver Dam Rd is a home located in Morgan County with nearby schools including Morgan County Primary School, Morgan County Elementary School, and Morgan County Middle School.
Ownership History
Date
Name
Owned For
Owner Type
Purchase Details
Closed on
Sep 16, 2021
Sold by
Williams Gladioli Worthem
Bought by
Fountain Gloria C
Current Estimated Value
Purchase Details
Closed on
Aug 24, 2017
Sold by
Chester Jacquelyn P
Bought by
Fountain Gloria C
Purchase Details
Closed on
Jan 19, 2017
Sold by
Worthem Gladioli J
Bought by
Mazzuckelli Thomas J
Home Financials for this Owner
Home Financials are based on the most recent Mortgage that was taken out on this home.
Original Mortgage
$249,460
Interest Rate
4.3%
Mortgage Type
New Conventional
Purchase Details
Closed on
Oct 2, 2001
Sold by
Chester Tommy
Bought by
Chester Amy E
Purchase Details
Closed on
Jan 1, 1961
Sold by
Nolan Mrs Ovella A
Bought by
Chester Tommy
Create a Home Valuation Report for This Property
The Home Valuation Report is an in-depth analysis detailing your home's value as well as a comparison with similar homes in the area
Home Values in the Area
Average Home Value in this Area
Purchase History
| Date | Buyer | Sale Price | Title Company |
|---|---|---|---|
| Fountain Gloria C | $22,060 | -- | |
| Fountain Gloria C | -- | -- | |
| Fountain Gloria C | -- | -- | |
| Fountain Gloria C | $119,864 | -- | |
| Mazzuckelli Thomas J | $293,486 | -- | |
| Chester Amy E | -- | -- | |
| Chester Tommy | -- | -- |
Source: Public Records
Mortgage History
| Date | Status | Borrower | Loan Amount |
|---|---|---|---|
| Previous Owner | Mazzuckelli Thomas J | $249,460 |
Source: Public Records
Tax History Compared to Growth
Tax History
| Year | Tax Paid | Tax Assessment Tax Assessment Total Assessment is a certain percentage of the fair market value that is determined by local assessors to be the total taxable value of land and additions on the property. | Land | Improvement |
|---|---|---|---|---|
| 2025 | $987 | $44,051 | $44,051 | $0 |
| 2024 | $434 | $19,040 | $19,040 | $0 |
| 2023 | $413 | $17,560 | $17,560 | $0 |
| 2022 | $430 | $17,560 | $17,560 | $0 |
| 2021 | $433 | $17,648 | $17,648 | $0 |
| 2020 | $437 | $17,648 | $17,648 | $0 |
| 2019 | $445 | $17,648 | $17,648 | $0 |
| 2018 | $414 | $16,204 | $16,204 | $0 |
| 2016 | $3,372 | $127,466 | $121,060 | $6,406 |
| 2015 | $151 | $131,922 | $125,680 | $6,242 |
| 2014 | $90 | $99,778 | $95,400 | $4,378 |
| 2013 | -- | $115,537 | $111,640 | $3,897 |
Source: Public Records
Map
Nearby Homes
- 1700 Beaver Dam Rd
- 1560 Beaver Dam Rd
- 1111 Pintail Ln
- LOT 24 Apalachee Rd
- 4000 Bostwick Hwy
- 1101 Shockley Rd
- 1211 Parsonage Rd
- 2911 A Sandy Creek Rd
- 0 Sandy Creek Rd Unit TRACT 4 10326316
- 2911 A Sandy Creek Rd
- LOT 8 Wallace Rd
- LOT 14 Wallace Rd
- LOT 12 Wallace Rd
- LOT 13 Wallace Rd
- 1310 Wallace Rd
- 0 Plantation Rd Unit 10449710
- 0 Plantation Rd Unit 22512873
- 0 Plantation Rd Unit 10449769
- 0 Plantation Rd Unit 22512874
- 1941 Beaver Dam Rd
- 0 Beaver Dam Rd Unit 3061077
- 0 Beaver Dam Rd Unit 7061023
- 0 Beaver Dam Rd Unit 7201107
- 0 Beaver Dam Rd Unit 7403167
- 0 Beaver Dam Rd Unit 5117911
- 0 Beaver Dam Rd Unit 5234318
- 0 Beaver Dam Rd Unit 987821
- 0 Beaver Dam Rd Unit 61559
- 0 Beaver Dam Rd Unit 10039219
- 0 Beaver Dam Rd Unit 28387
- 2251 Beaver Dam Rd
- 1961 Beaver Dam Rd
- 1700 Beaverdam Rd
- 1800 Beaver Dam Rd
- 1641 Beaver Dam Rd
- 2080 Beaver Dam Rd
- 1021 Mallard Ct
- 1010 Mallard Ridge Rd
- 1020 Mallard Ridge Rd