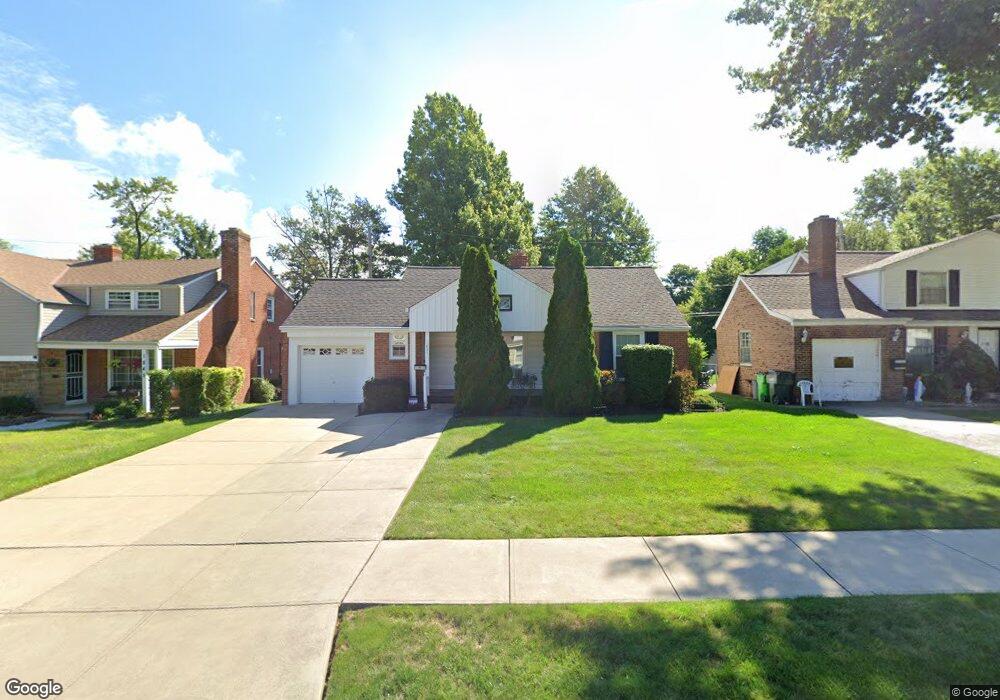
1851 E 225th St Euclid, OH 44117
Estimated Value: $144,798 - $190,000
2
Beds
1
Bath
1,063
Sq Ft
$160/Sq Ft
Est. Value
About This Home
This home is located at 1851 E 225th St, Euclid, OH 44117 and is currently estimated at $170,450, approximately $160 per square foot. 1851 E 225th St is a home located in Cuyahoga County with nearby schools including Thomas Jefferson Elementary School, Euclid Middle School, and Euclid High School.
Ownership History
Date
Name
Owned For
Owner Type
Purchase Details
Closed on
Aug 20, 2007
Sold by
Matic George T and Matic Susan M
Bought by
Hobbs Quinzella E
Current Estimated Value
Home Financials for this Owner
Home Financials are based on the most recent Mortgage that was taken out on this home.
Original Mortgage
$119,000
Interest Rate
6.31%
Mortgage Type
Purchase Money Mortgage
Purchase Details
Closed on
Jan 8, 1982
Sold by
Mccreanor Terrence J
Bought by
Matic George T
Purchase Details
Closed on
Dec 14, 1979
Sold by
Andrea E
Bought by
Mccreanor Terrence J
Purchase Details
Closed on
Jan 1, 1975
Bought by
Andrea E
Create a Home Valuation Report for This Property
The Home Valuation Report is an in-depth analysis detailing your home's value as well as a comparison with similar homes in the area
Home Values in the Area
Average Home Value in this Area
Purchase History
| Date | Buyer | Sale Price | Title Company |
|---|---|---|---|
| Hobbs Quinzella E | $119,000 | Land American-Lawyers Title | |
| Matic George T | $61,000 | -- | |
| Mccreanor Terrence J | -- | -- | |
| Andrea E | -- | -- |
Source: Public Records
Mortgage History
| Date | Status | Borrower | Loan Amount |
|---|---|---|---|
| Previous Owner | Hobbs Quinzella E | $119,000 |
Source: Public Records
Tax History
| Year | Tax Paid | Tax Assessment Tax Assessment Total Assessment is a certain percentage of the fair market value that is determined by local assessors to be the total taxable value of land and additions on the property. | Land | Improvement |
|---|---|---|---|---|
| 2024 | $3,086 | $44,660 | $10,780 | $33,880 |
| 2023 | $3,073 | $35,630 | $8,400 | $27,230 |
| 2022 | $3,003 | $35,630 | $8,400 | $27,230 |
| 2021 | $3,347 | $35,630 | $8,400 | $27,230 |
| 2020 | $3,175 | $30,730 | $7,250 | $23,490 |
| 2019 | $2,856 | $87,800 | $20,700 | $67,100 |
| 2018 | $2,887 | $30,730 | $7,250 | $23,490 |
| 2017 | $3,319 | $29,650 | $5,850 | $23,800 |
| 2016 | $3,326 | $29,650 | $5,850 | $23,800 |
| 2015 | $3,026 | $29,650 | $5,850 | $23,800 |
| 2014 | $3,026 | $29,650 | $5,850 | $23,800 |
Source: Public Records
Map
Nearby Homes
- 21950 Euclid Ave
- 1754 E 236th St
- 1554 E 221st St
- 1545 E 214th St
- 1765 E 238th St
- 1775 Sherwood Blvd
- 24105 Chardon Rd
- 22791 Harms Rd
- 22601 Harms Rd
- 1734 Glenridge Rd
- 363 Balmoral Dr
- 1524 E 204th St
- 24 Washington Square Unit 15
- 1721 Grand Blvd
- 25031 Glenbrook Blvd
- 1934 Beverly Hills Dr
- 19210 Firwood Rd
- 209 Greenbriar Ct
- 24691 Hawthorne Dr
- 24801 Highland Rd
- 1855 E 225th St
- 1845 E 225th St
- 1861 E 225th St
- 1841 E 225th St
- 1830 E 227th St
- 1824 E 227th St
- 1840 E 227th St
- 1839 E 225th St
- 1820 E 227th St
- 1850 E 225th St
- 1844 E 225th St
- 1854 E 225th St
- 1844 E 227th St
- 1814 E 227th St
- 1871 E 225th St
- 1840 E 225th St
- 1860 E 225th St
- 1836 E 225th St
- 1850 E 227th St
- 1810 E 227th St
Your Personal Tour Guide
Ask me questions while you tour the home.