Estimated Value: $349,000 - $388,000
4
Beds
3
Baths
2,464
Sq Ft
$147/Sq Ft
Est. Value
About This Home
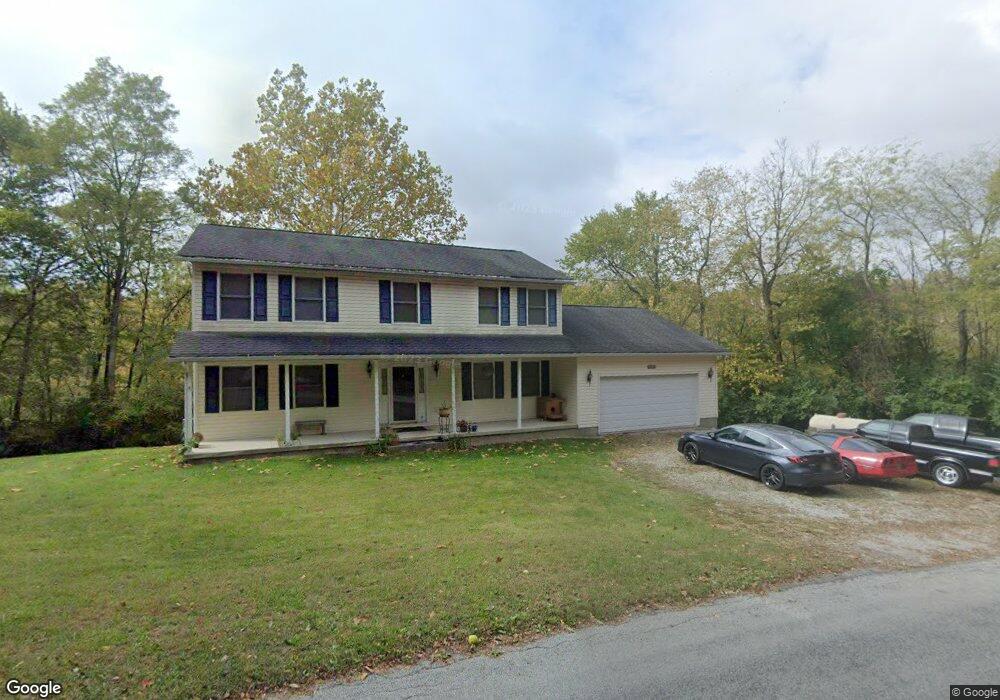
This home is located at 1851 Jones Rd, Xenia, OH 45385 and is currently estimated at $362,220, approximately $147 per square foot. 1851 Jones Rd is a home located in Greene County with nearby schools including Xenia High School.
Ownership History
Date
Name
Owned For
Owner Type
Purchase Details
Closed on
Jan 30, 2017
Sold by
Taylor Joel A and Taylor Rachel E
Bought by
Kraushaar Marcus K
Current Estimated Value
Home Financials for this Owner
Home Financials are based on the most recent Mortgage that was taken out on this home.
Original Mortgage
$183,870
Outstanding Balance
$152,745
Interest Rate
4.32%
Mortgage Type
VA
Estimated Equity
$209,475
Purchase Details
Closed on
Apr 29, 2014
Sold by
Shaw Rachel I
Bought by
Taylor Joel and Taylor Rachel
Home Financials for this Owner
Home Financials are based on the most recent Mortgage that was taken out on this home.
Original Mortgage
$32,250
Interest Rate
4.33%
Mortgage Type
Unknown
Purchase Details
Closed on
May 4, 2006
Sold by
Taylor Joel A and Taylor Rachel E
Bought by
Taylor Joel A and Taylor Rachel E
Purchase Details
Closed on
May 6, 2005
Sold by
Shaw John J and Shaw Rachel I
Bought by
Taylor Joel A and Taylor Rachel E
Create a Home Valuation Report for This Property
The Home Valuation Report is an in-depth analysis detailing your home's value as well as a comparison with similar homes in the area
Home Values in the Area
Average Home Value in this Area
Purchase History
| Date | Buyer | Sale Price | Title Company |
|---|---|---|---|
| Kraushaar Marcus K | $180,000 | None Available | |
| Taylor Joel | $43,000 | None Available | |
| Taylor Joel A | -- | None Available | |
| Taylor Joel A | -- | -- |
Source: Public Records
Mortgage History
| Date | Status | Borrower | Loan Amount |
|---|---|---|---|
| Open | Kraushaar Marcus K | $183,870 | |
| Previous Owner | Taylor Joel | $32,250 |
Source: Public Records
Tax History Compared to Growth
Tax History
| Year | Tax Paid | Tax Assessment Tax Assessment Total Assessment is a certain percentage of the fair market value that is determined by local assessors to be the total taxable value of land and additions on the property. | Land | Improvement |
|---|---|---|---|---|
| 2024 | $3,888 | $81,980 | $7,920 | $74,060 |
| 2023 | $3,888 | $81,980 | $7,920 | $74,060 |
| 2022 | $3,353 | $64,140 | $6,890 | $57,250 |
| 2021 | $3,395 | $64,140 | $6,890 | $57,250 |
| 2020 | $3,269 | $64,140 | $6,890 | $57,250 |
| 2019 | $2,819 | $51,910 | $6,200 | $45,710 |
| 2018 | $2,829 | $51,910 | $6,200 | $45,710 |
| 2017 | $2,818 | $51,910 | $6,200 | $45,710 |
| 2016 | $2,843 | $50,100 | $5,940 | $44,160 |
| 2015 | $2,850 | $50,100 | $5,940 | $44,160 |
| 2014 | $2,737 | $50,100 | $5,940 | $44,160 |
Source: Public Records
Map
Nearby Homes
- 0 Mason Rd
- 1287 Brush Row Rd
- 460 Kinsey Rd
- 983 Echo Ct
- 1764 Highlander Dr
- 0 Us 42 Unit 941174
- 965 Oak Dale Dr
- 2448 Sutton Rd
- 902 N Bickett Rd
- 1359 Eagles Way
- 15 Sexton Dr
- 1311 Eagles Way
- 2537 Ridge Rd
- 2710 Sutton Rd
- 2018 Tahoe Dr
- 2094 Malibu Trail
- 656 Eden Roc Dr
- 610 Saxony Dr
- 1171 N Detroit St
- 1872 Harris Ln
- 1875 Jones Rd
- 1860 Jones Rd
- 1910 Stevenson Rd
- 877 Lewis Creek Ct
- 905 Lewis Creek Ct
- 2013 Stevenson Rd
- 1954 Stevenson Rd
- 870 Lewis Creek Ct
- 1980 Stevenson Rd
- 918 Lewis Creek Ct
- 928 Lewis Creek Ct
- 1717 Stevenson Rd
- 3 Lewis Creek Ct
- 1662 Stevenson Rd
- 1664 Stevenson Rd
- 860 Brush Row Rd
- 0 Jones Rd Unit 807415
- 1 Jones Rd
- 2070 Stevenson Rd
- 1691 Jones Rd