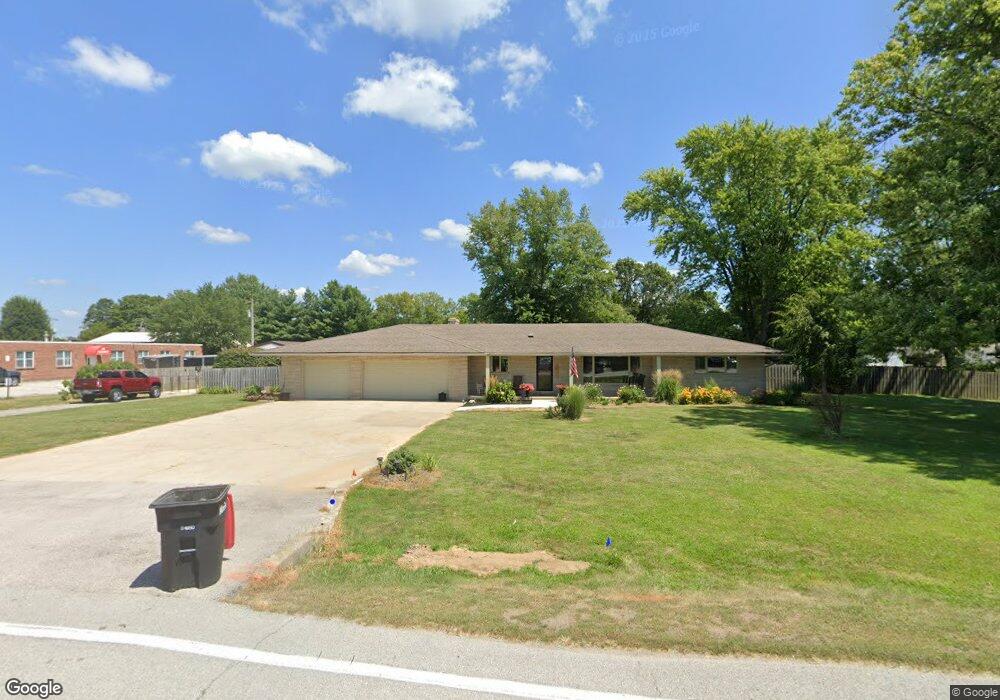
1851 N Us Highway 421 Delphi, IN 46923
Estimated Value: $280,000 - $350,330
3
Beds
3
Baths
2,077
Sq Ft
$150/Sq Ft
Est. Value
About This Home
This home is located at 1851 N Us Highway 421, Delphi, IN 46923 and is currently estimated at $312,333, approximately $150 per square foot. 1851 N Us Highway 421 is a home located in Carroll County with nearby schools including Delphi Community Elementary School, Delphi Community Middle School, and Delphi Community High School.
Ownership History
Date
Name
Owned For
Owner Type
Purchase Details
Closed on
Mar 25, 2020
Sold by
Snipes Sorrells Vicky F and Snipes Vicky F
Bought by
Snipes Sorrells Vicky F
Current Estimated Value
Home Financials for this Owner
Home Financials are based on the most recent Mortgage that was taken out on this home.
Original Mortgage
$95,500
Outstanding Balance
$44,339
Interest Rate
3.2%
Mortgage Type
New Conventional
Estimated Equity
$267,994
Purchase Details
Closed on
Sep 8, 2014
Sold by
Murdock Michael D
Bought by
Snipes Vicky F
Home Financials for this Owner
Home Financials are based on the most recent Mortgage that was taken out on this home.
Original Mortgage
$77,600
Interest Rate
4.07%
Create a Home Valuation Report for This Property
The Home Valuation Report is an in-depth analysis detailing your home's value as well as a comparison with similar homes in the area
Home Values in the Area
Average Home Value in this Area
Purchase History
| Date | Buyer | Sale Price | Title Company |
|---|---|---|---|
| Snipes Sorrells Vicky F | -- | Columbia Title Inc | |
| Snipes Vicky F | -- | None Available |
Source: Public Records
Mortgage History
| Date | Status | Borrower | Loan Amount |
|---|---|---|---|
| Open | Snipes Sorrells Vicky F | $95,500 | |
| Closed | Snipes Vicky F | $77,600 |
Source: Public Records
Tax History
| Year | Tax Paid | Tax Assessment Tax Assessment Total Assessment is a certain percentage of the fair market value that is determined by local assessors to be the total taxable value of land and additions on the property. | Land | Improvement |
|---|---|---|---|---|
| 2025 | $2,267 | $251,000 | $32,800 | $218,200 |
| 2024 | $2,267 | $220,900 | $32,800 | $188,100 |
| 2023 | $1,821 | $192,900 | $32,800 | $160,100 |
| 2022 | $1,821 | $178,500 | $29,800 | $148,700 |
| 2021 | $1,623 | $158,200 | $28,700 | $129,500 |
| 2020 | $1,581 | $152,900 | $28,700 | $124,200 |
| 2019 | $1,480 | $142,000 | $28,700 | $113,300 |
| 2018 | $1,517 | $136,700 | $28,700 | $108,000 |
| 2017 | $1,472 | $138,000 | $29,400 | $108,600 |
| 2016 | $1,427 | $133,500 | $29,400 | $104,100 |
| 2014 | $1,301 | $129,900 | $29,400 | $100,500 |
Source: Public Records
Map
Nearby Homes
- 200 Heritage Dr
- 202 Heritage Dr
- 409 Heritage Dr
- 228 W Vine St
- 230 W Vine St
- 232 W Vine St
- 112 Williston Ct
- 415 S Illinois St
- 201 E Franklin St
- 409 E Franklin St
- 519 E Franklin St
- 411 W Franklin St
- 109 N Lafayette St
- 317 N Market St
- 409 N Wilson St
- 416 N Indiana St
- 610 N Wilson St
- 103 E Harrison St
- 0 N County Road 100 E Unit 202610986
- 382 U S 421
- 1833 N Us Highway 421
- 1433 S Washington St
- 1819 N Us Highway 421
- 7122 W Crestwood Dr
- 7106 W Crestwood Dr
- 7140 W Crestwood Dr
- 7090 W Crestwood Dr
- 1807 N Us Highway 421
- 7154 W Crestwood Dr
- 7074 W Crestwood Dr
- 1789 N Us Highway 421
- 7172 W Crestwood Dr
- 7139 W Crestwood Dr
- 7123 W Crestwood Dr
- 7060 W Crestwood Dr
- 7153 W Crestwood Dr
- 7107 W Crestwood Dr
- 1763 N Us Highway 421
- 7216 W 200 N
- 7091 W Crestwood Dr
Your Personal Tour Guide
Ask me questions while you tour the home.