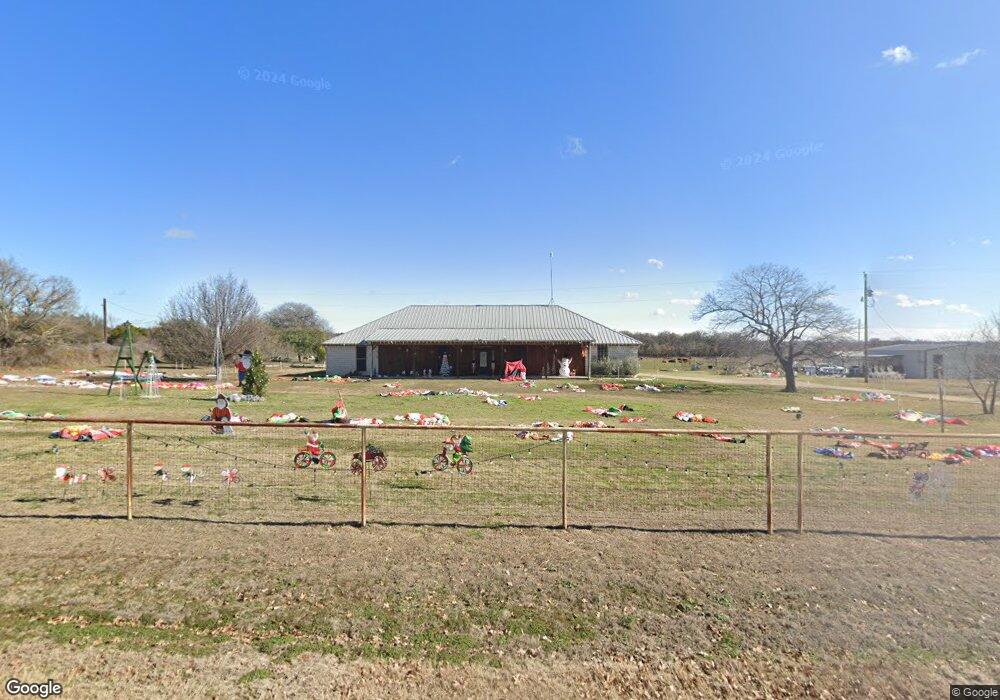
1851 Newberry Rd Millsap, TX 76066
Estimated Value: $606,000
--
Bed
--
Bath
2,623
Sq Ft
$231/Sq Ft
Est. Value
About This Home
This home is located at 1851 Newberry Rd, Millsap, TX 76066 and is currently estimated at $606,000, approximately $231 per square foot. 1851 Newberry Rd is a home located in Parker County with nearby schools including Millsap Elementary School, Millsap Middle School, and Millsap High School.
Ownership History
Date
Name
Owned For
Owner Type
Purchase Details
Closed on
Sep 16, 2015
Sold by
Clary Carla D and Clary Jimmy M
Bought by
Edwards Donna
Current Estimated Value
Purchase Details
Closed on
Mar 18, 2004
Sold by
Livingston Tommy R and Livingston Alva M
Bought by
Edwards Jeff and Edwards Donna
Create a Home Valuation Report for This Property
The Home Valuation Report is an in-depth analysis detailing your home's value as well as a comparison with similar homes in the area
Home Values in the Area
Average Home Value in this Area
Purchase History
| Date | Buyer | Sale Price | Title Company |
|---|---|---|---|
| Edwards Donna | -- | Attorney | |
| Edwards Jeff | -- | -- |
Source: Public Records
Tax History Compared to Growth
Tax History
| Year | Tax Paid | Tax Assessment Tax Assessment Total Assessment is a certain percentage of the fair market value that is determined by local assessors to be the total taxable value of land and additions on the property. | Land | Improvement |
|---|---|---|---|---|
| 2025 | $5,369 | $418,720 | $47,500 | $371,220 |
| 2024 | $5,369 | $396,190 | $29,290 | $366,900 |
| 2023 | $5,369 | $469,170 | $0 | $0 |
| 2022 | $8,093 | $432,650 | $157,490 | $275,160 |
| 2021 | $8,068 | $432,650 | $157,490 | $275,160 |
| 2020 | $7,584 | $401,670 | $128,330 | $273,340 |
| 2019 | $7,393 | $401,670 | $128,330 | $273,340 |
| 2018 | $6,797 | $305,990 | $60,000 | $245,990 |
| 2017 | $6,398 | $305,990 | $60,000 | $245,990 |
| 2016 | $5,816 | $240,760 | $53,330 | $187,430 |
| 2015 | $5,326 | $240,760 | $53,330 | $187,430 |
| 2014 | $5,247 | $229,660 | $49,330 | $180,330 |
Source: Public Records
Map
Nearby Homes
- 990 Doss Rd
- 4991 Old Millsap Rd
- 1651 Doss Rd
- 2101 Cool Jct
- 1747 Cool Jct
- 2500 Cool Jct Unit Tract 2
- 0000 Mineral Wells Hwy
- 5878 Greenwood Rd
- 417 Wood River Rd
- 9999 Trails End Cir
- 811 NE Front St
- TBD S Farm To Market Road 113
- 250 Young Rd
- 10309 Mineral Wells Hwy
- 2710 Fairview Rd
- 2017 Bedford Ct
- 800 Fox Rd
- 207 NE Front St
- 3200 Fairview Rd
- 211 N Cherry St
- 1815 Newberry Rd
- 1895 Newberry Rd
- 1900 Newberry Rd
- TBD 5 Newberry Rd
- 1733 Newberry Rd
- 2049 Newberry Rd
- 1700 Newberry Rd
- 2105 Newberry Rd
- 2150 Newberry Rd
- 2151 Newberry Rd
- 1751 Newberry Rd
- 2200 Newberry Rd
- 1835 Newberry Rd
- 1500 Newberry Rd
- 1810 Newberry Rd
- 2004 Newberry Rd
- 490 Cutters Ln
- 400 Cutters Ln
- 201 Cutters Ln
- 2 Doss Rd