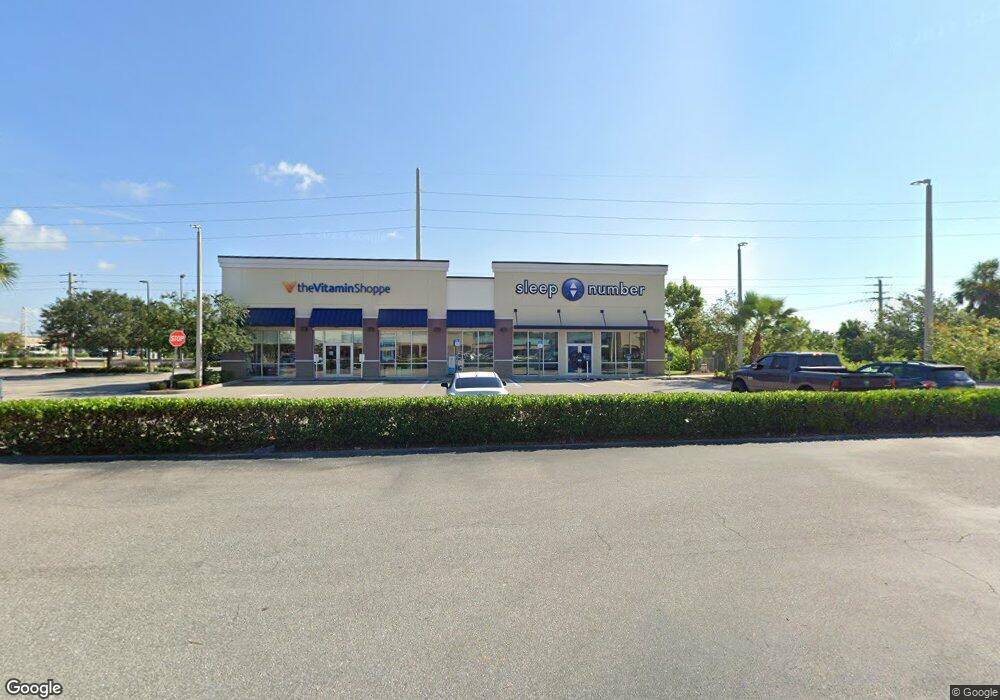
1851 Tamiami Trail Port Charlotte, FL 33948
Estimated Value: $2,597,280
--
Bed
4
Baths
5,225
Sq Ft
$497/Sq Ft
Est. Value
About This Home
This home is located at 1851 Tamiami Trail, Port Charlotte, FL 33948 and is currently estimated at $2,597,280, approximately $497 per square foot. 1851 Tamiami Trail is a home located in Charlotte County with nearby schools including Liberty Elementary School, Murdock Middle School, and Port Charlotte High School.
Ownership History
Date
Name
Owned For
Owner Type
Purchase Details
Closed on
Apr 26, 2023
Sold by
Teramore Development Llc
Bought by
Florida Investments 9 Llc
Current Estimated Value
Purchase Details
Closed on
Sep 25, 2015
Sold by
Holt William A and Holt Anita S
Bought by
Teramore Development Llc
Home Financials for this Owner
Home Financials are based on the most recent Mortgage that was taken out on this home.
Original Mortgage
$640,000
Interest Rate
3.97%
Mortgage Type
Commercial
Purchase Details
Closed on
Oct 3, 2000
Sold by
Holt Anita S and Holt William A
Bought by
Holt William A and Holt Anita S
Purchase Details
Closed on
Oct 22, 1997
Sold by
1St Union Natl Bk
Bought by
Holt Anita S
Home Financials for this Owner
Home Financials are based on the most recent Mortgage that was taken out on this home.
Original Mortgage
$187,500
Interest Rate
7.39%
Mortgage Type
Commercial
Create a Home Valuation Report for This Property
The Home Valuation Report is an in-depth analysis detailing your home's value as well as a comparison with similar homes in the area
Home Values in the Area
Average Home Value in this Area
Purchase History
| Date | Buyer | Sale Price | Title Company |
|---|---|---|---|
| Florida Investments 9 Llc | $3,000,000 | None Listed On Document | |
| Teramore Development Llc | $800,000 | Attorney | |
| Holt William A | $203,700 | -- | |
| Holt Anita S | -- | -- |
Source: Public Records
Mortgage History
| Date | Status | Borrower | Loan Amount |
|---|---|---|---|
| Previous Owner | Teramore Development Llc | $640,000 | |
| Previous Owner | Holt Anita S | $187,500 |
Source: Public Records
Tax History Compared to Growth
Tax History
| Year | Tax Paid | Tax Assessment Tax Assessment Total Assessment is a certain percentage of the fair market value that is determined by local assessors to be the total taxable value of land and additions on the property. | Land | Improvement |
|---|---|---|---|---|
| 2025 | $20,117 | $1,291,340 | $450,782 | $840,558 |
| 2024 | $17,799 | $1,201,746 | $409,802 | $791,944 |
| 2023 | $17,799 | $1,019,450 | $368,822 | $650,628 |
| 2022 | $16,455 | $942,267 | $368,822 | $573,445 |
| 2021 | $15,907 | $872,154 | $368,822 | $503,332 |
| 2020 | $15,617 | $854,013 | $368,822 | $485,191 |
| 2019 | $15,148 | $818,955 | $368,822 | $450,133 |
| 2018 | $13,788 | $777,048 | $353,455 | $423,593 |
| 2017 | $13,982 | $778,965 | $409,802 | $369,163 |
| 2016 | $12,407 | $680,077 | $0 | $0 |
| 2015 | $11,426 | $610,347 | $0 | $0 |
| 2014 | $11,332 | $610,202 | $0 | $0 |
Source: Public Records
Map
Nearby Homes
- 1181 Seacrest Dr NW
- 1190 Seacrest Dr NW
- 1035 Red Bay Terrace NW
- 1073 Arden Terrace NW
- 19077 Cochran Blvd
- 19505 Quesada Ave Unit C201
- 19505 Quesada Ave Unit OO206
- 19505 Quesada Ave Unit A204
- 19505 Quesada Ave Unit EE103
- 19505 Quesada Ave Unit VV201
- 19505 Quesada Ave Unit EE201
- 19505 Quesada Ave Unit SS201
- 19505 Quesada Ave Unit C103
- 19505 Quesada Ave Unit EE204
- 19505 Quesada Ave Unit BB102
- 19505 Quesada Ave Unit CC103
- 2120 Broad Ranch Dr
- 1237 Pike Ave NW
- 2201 Hyatt Dr
- 906 Bayard Terrace
- 1811 Tamiami Trail
- 0 Tamiami Trail Unit C690197
- 0 Tamiami Trail Unit A377323
- 0 Tamiami Trail Unit C7015144
- 1931 Tamiami Trail Unit 8&9B
- 1931 Tamiami Trail Unit 10
- 1931 Tamiami Trail
- 1931 Tamiami Trail Unit 7
- 1931 Tamiami Trail Unit 1
- 1931 Tamiami Trail Unit 8
- 19239 Baoy Ave
- 19223 Baoy Ave
- 1900 Tamiami Trail
- 1000 Vega Ave NW
- 1016 Vega Ave NW
- 1032 Vega Ave NW
- 1295 Sheridan Dr NW
- 1048 Vega Ave NW
- 19125 Baoy Ave