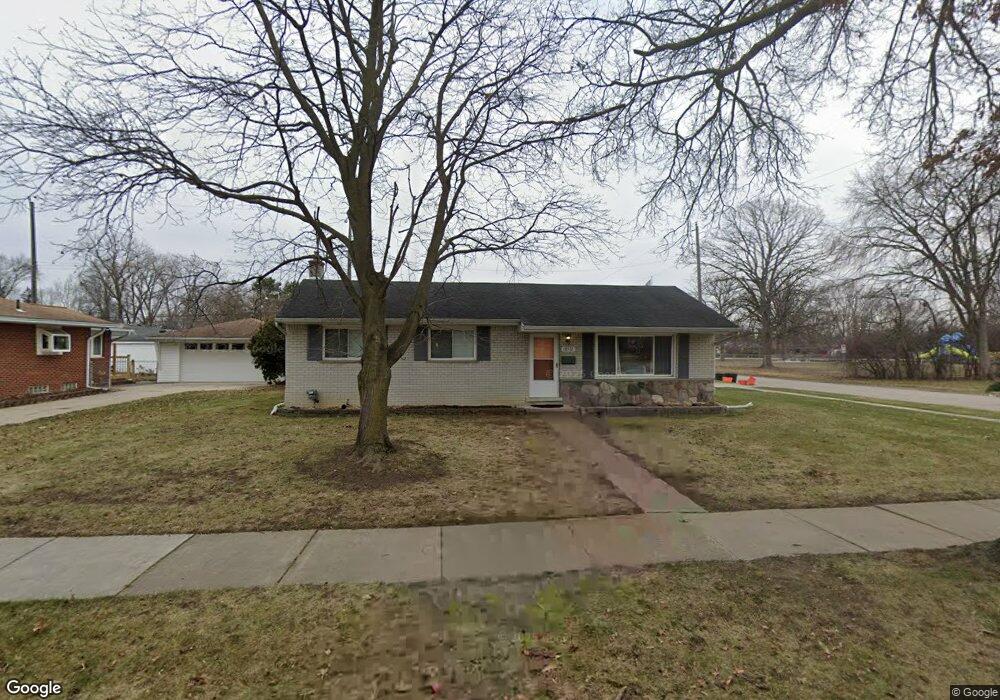
18512 Hillcrest St Livonia, MI 48152
Estimated Value: $278,000 - $298,000
3
Beds
2
Baths
1,106
Sq Ft
$260/Sq Ft
Est. Value
About This Home
This home is located at 18512 Hillcrest St, Livonia, MI 48152 and is currently estimated at $287,992, approximately $260 per square foot. 18512 Hillcrest St is a home located in Wayne County with nearby schools including Coolidge Elementary School, Webster Elementary School, and Riley Upper Elementary School.
Ownership History
Date
Name
Owned For
Owner Type
Purchase Details
Closed on
Sep 16, 2019
Sold by
Nardizzi Jaime
Bought by
Nardizzi Jaime and Nardizzi Tabitha
Current Estimated Value
Purchase Details
Closed on
Mar 31, 2008
Sold by
Burney Philippe A
Bought by
Nardizzi Jaime
Purchase Details
Closed on
Sep 26, 2007
Sold by
Burney Philippe A and Burney Leah D
Bought by
P B Management Co Llc
Purchase Details
Closed on
Jan 3, 2007
Sold by
Elliott David M and Elliott Theresa A
Bought by
The Bank Of New York Trust Co Na and Jp Morgan Chase Bank
Purchase Details
Closed on
Jul 30, 2003
Sold by
Hadley David and Hadley Marlene
Bought by
Elliott David
Purchase Details
Closed on
Sep 25, 2001
Sold by
Congdon Marlene S
Bought by
Hadley David
Home Financials for this Owner
Home Financials are based on the most recent Mortgage that was taken out on this home.
Original Mortgage
$89,000
Interest Rate
6.8%
Create a Home Valuation Report for This Property
The Home Valuation Report is an in-depth analysis detailing your home's value as well as a comparison with similar homes in the area
Home Values in the Area
Average Home Value in this Area
Purchase History
| Date | Buyer | Sale Price | Title Company |
|---|---|---|---|
| Nardizzi Jaime | -- | None Available | |
| Nardizzi Jaime | $156,500 | Multiple | |
| P B Management Co Llc | -- | E Title Agency | |
| The Bank Of New York Trust Co Na | $129,625 | None Available | |
| Elliott David | $147,600 | Alpha Title Agency Inc | |
| Hadley David | -- | -- |
Source: Public Records
Mortgage History
| Date | Status | Borrower | Loan Amount |
|---|---|---|---|
| Previous Owner | Hadley David | $89,000 |
Source: Public Records
Tax History Compared to Growth
Tax History
| Year | Tax Paid | Tax Assessment Tax Assessment Total Assessment is a certain percentage of the fair market value that is determined by local assessors to be the total taxable value of land and additions on the property. | Land | Improvement |
|---|---|---|---|---|
| 2025 | $1,513 | $122,300 | $0 | $0 |
| 2024 | $1,513 | $110,300 | $0 | $0 |
| 2023 | $1,443 | $103,400 | $0 | $0 |
| 2022 | $2,534 | $92,400 | $0 | $0 |
| 2021 | $2,712 | $85,800 | $0 | $0 |
| 2019 | $2,362 | $79,400 | $0 | $0 |
| 2018 | $1,220 | $73,500 | $0 | $0 |
| 2017 | $3,223 | $71,300 | $0 | $0 |
| 2016 | $2,584 | $69,100 | $0 | $0 |
| 2015 | $5,428 | $61,200 | $0 | $0 |
| 2012 | -- | $51,360 | $16,940 | $34,420 |
Source: Public Records
Map
Nearby Homes
- 18659 Flamingo Blvd
- 18725 Flamingo Blvd
- 18872 Hillcrest St
- 30285 7 Mile Rd
- 29721 Pickford St
- 29560 Clarita St Unit 11
- 19021 Merriman Rd
- 31366 Mayville St
- 29836 Bobrich St
- 29945 6 Mile Rd
- 19436 Donna St
- 29675 Nottingham Cir Unit 20
- 31419 Fairfax St
- 30115 Munger Dr
- 30425 Munger Dr
- 19443 Auburndale St
- 19921 Melvin St
- 19647 Osmus St
- 31069 Munger Dr
- 30947 Kenwood Ct
- 18536 Hillcrest St
- 18577 Purlingbrook St
- 18599 Purlingbrook St
- 18560 Hillcrest St
- 18511 Hillcrest St
- 18523 Hillcrest St Unit Bldg-Unit
- 18523 Hillcrest St
- 18621 Purlingbrook St
- 30425 Pickford St
- 18535 Hillcrest St
- 18547 Hillcrest St Unit Bldg-Unit
- 18547 Hillcrest St
- 18588 Hillcrest St
- 18559 Hillcrest St
- 18643 Purlingbrook St
- 18571 Hillcrest St
- 18576 Purlingbrook St
- 18528 Flamingo Blvd
- 18596 Purlingbrook St
- 30477 Pickford St