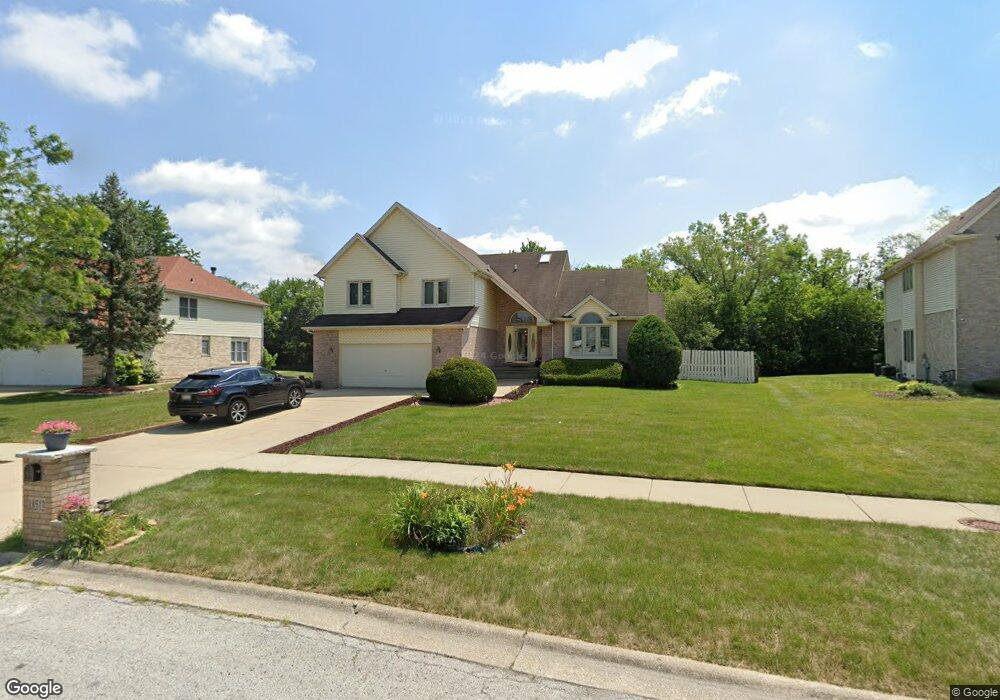
18513 River Rd Hazel Crest, IL 60429
Village West NeighborhoodEstimated Value: $388,000 - $475,000
3
Beds
3
Baths
2,617
Sq Ft
$161/Sq Ft
Est. Value
About This Home
This home is located at 18513 River Rd, Hazel Crest, IL 60429 and is currently estimated at $420,535, approximately $160 per square foot. 18513 River Rd is a home located in Cook County with nearby schools including Flossmoor Hills Elementary School, Parker Junior High School, and Homewood-Flossmoor High School.
Ownership History
Date
Name
Owned For
Owner Type
Purchase Details
Closed on
Jun 1, 2005
Sold by
Anderson Edward J and Anderson Ltonia K
Bought by
Karriem Keesha
Current Estimated Value
Home Financials for this Owner
Home Financials are based on the most recent Mortgage that was taken out on this home.
Original Mortgage
$279,000
Outstanding Balance
$142,929
Interest Rate
5.87%
Mortgage Type
Fannie Mae Freddie Mac
Estimated Equity
$277,606
Purchase Details
Closed on
Jan 20, 1998
Sold by
Grand Premier Trust & Investment Inc Na
Bought by
Anderson Edward J and Anderson Latonia K
Home Financials for this Owner
Home Financials are based on the most recent Mortgage that was taken out on this home.
Original Mortgage
$220,400
Interest Rate
7.25%
Create a Home Valuation Report for This Property
The Home Valuation Report is an in-depth analysis detailing your home's value as well as a comparison with similar homes in the area
Home Values in the Area
Average Home Value in this Area
Purchase History
| Date | Buyer | Sale Price | Title Company |
|---|---|---|---|
| Karriem Keesha | $310,000 | Fatic | |
| Anderson Edward J | $248,000 | -- |
Source: Public Records
Mortgage History
| Date | Status | Borrower | Loan Amount |
|---|---|---|---|
| Open | Karriem Keesha | $279,000 | |
| Previous Owner | Anderson Edward J | $220,400 |
Source: Public Records
Tax History
| Year | Tax Paid | Tax Assessment Tax Assessment Total Assessment is a certain percentage of the fair market value that is determined by local assessors to be the total taxable value of land and additions on the property. | Land | Improvement |
|---|---|---|---|---|
| 2025 | $16,714 | $31,349 | $8,633 | $22,716 |
| 2024 | $16,714 | $31,349 | $8,633 | $22,716 |
| 2023 | $14,366 | $35,000 | $8,633 | $26,367 |
| 2022 | $14,366 | $23,225 | $7,597 | $15,628 |
| 2021 | $14,258 | $23,224 | $7,597 | $15,627 |
| 2020 | $13,490 | $23,224 | $7,597 | $15,627 |
| 2019 | $10,772 | $18,944 | $6,906 | $12,038 |
| 2018 | $11,621 | $20,843 | $6,906 | $13,937 |
| 2017 | $11,085 | $20,843 | $6,906 | $13,937 |
| 2016 | $11,340 | $20,937 | $6,215 | $14,722 |
| 2015 | $11,099 | $20,937 | $6,215 | $14,722 |
| 2014 | $10,772 | $20,937 | $6,215 | $14,722 |
| 2013 | $11,470 | $24,432 | $6,215 | $18,217 |
Source: Public Records
Map
Nearby Homes
- 18600 Village West Dr Unit 310
- 18600 Village West Dr Unit 303
- 3710 Briar Ln
- 3800 River Rd
- 18309 Carrington Dr
- 3600 183rd St
- 754 Central Park Ave
- 3902 Edgewater Dr
- 3641 Beech St
- 3360 184th St Unit 3W
- 3360 184th St Unit 1E
- 3314 185th Place
- 3712 Beech St
- 800 Elm St
- 3536 Marseilles Ln
- 835 Maple Rd
- 4445 Provincetown Dr
- 18108 Fountainbleau Dr
- 4036 W 187th St
- 18424 Kedzie Ave Unit 2A
- 18511 River Rd
- 18509 River Rd
- 18509 River Rd
- 3603 River Rd
- 18505 Alexis Ct Unit 4
- 3604 River Rd
- 18507 River Rd
- 3605 River Rd
- 18604 Emily Ct Unit 22
- 18606 Emily Ct Unit 21
- 18602 Emily Ct Unit 23
- 18504 River Rd
- 3606 River Rd
- 18607 Emily Ct Unit 28
- 18608 Emily Ct Unit 20
- 18605 Emily Ct Unit 27
- 18505 River Rd
- 3607 River Rd Unit 4
- 18504 Alexis Ct
Your Personal Tour Guide
Ask me questions while you tour the home.