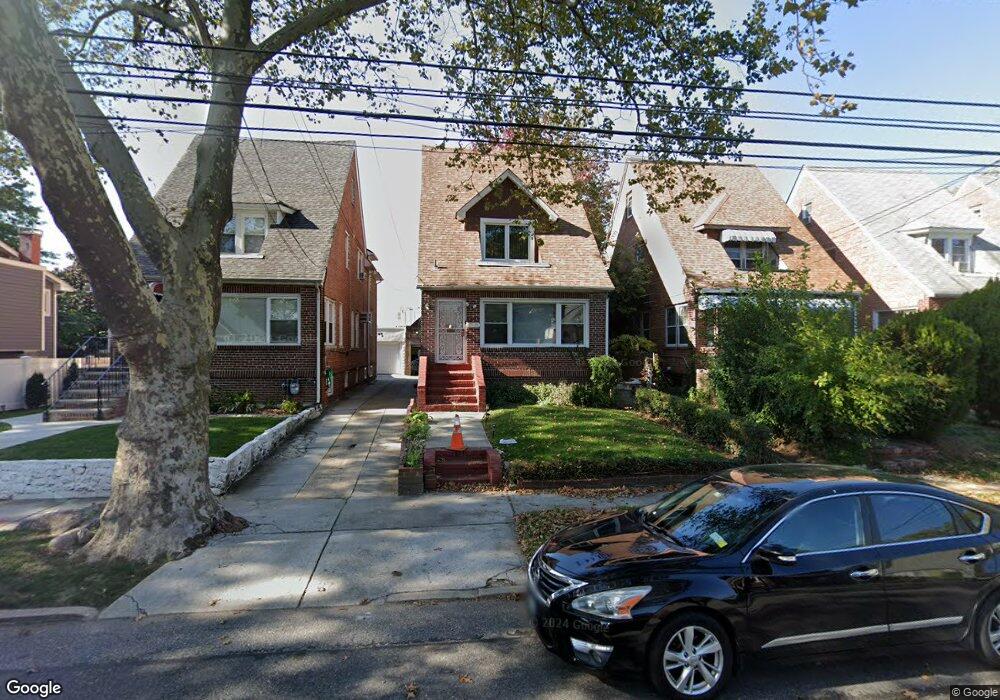
18515 Ilion Ave Saint Albans, NY 11412
Hollis NeighborhoodEstimated Value: $736,744 - $861,000
--
Bed
--
Bath
1,910
Sq Ft
$420/Sq Ft
Est. Value
About This Home
This home is located at 18515 Ilion Ave, Saint Albans, NY 11412 and is currently estimated at $802,686, approximately $420 per square foot. 18515 Ilion Ave is a home located in Queens County with nearby schools including P.S. 118 Lorraine Hansberry, I.S. 192 The Linden, and Riverton Street Charter School.
Ownership History
Date
Name
Owned For
Owner Type
Purchase Details
Closed on
May 7, 2024
Sold by
Cummings Lisa
Bought by
Cummings Jole and Cummings Lisa C
Current Estimated Value
Purchase Details
Closed on
Mar 20, 2024
Sold by
Cummings Joel and Cummings Lisa C
Bought by
Cummings Lisa C
Purchase Details
Closed on
Mar 15, 2007
Sold by
Jean-Pierre Albertine
Bought by
Cummings Joel and Cummings Lisa
Home Financials for this Owner
Home Financials are based on the most recent Mortgage that was taken out on this home.
Original Mortgage
$280,000
Outstanding Balance
$169,287
Interest Rate
6.33%
Mortgage Type
Purchase Money Mortgage
Estimated Equity
$633,399
Purchase Details
Closed on
Jul 6, 1993
Sold by
Jean Pierre Albertine and Cazeau Lucena
Bought by
Jean Pierre Albertine
Create a Home Valuation Report for This Property
The Home Valuation Report is an in-depth analysis detailing your home's value as well as a comparison with similar homes in the area
Home Values in the Area
Average Home Value in this Area
Purchase History
| Date | Buyer | Sale Price | Title Company |
|---|---|---|---|
| Cummings Jole | -- | -- | |
| Cummings Jole | -- | -- | |
| Cummings Lisa C | $370,500 | -- | |
| Cummings Lisa C | $370,500 | -- | |
| Cummings Joel | $509,000 | -- | |
| Cummings Joel | $509,000 | -- | |
| Jean Pierre Albertine | -- | -- | |
| Jean Pierre Albertine | -- | -- |
Source: Public Records
Mortgage History
| Date | Status | Borrower | Loan Amount |
|---|---|---|---|
| Open | Cummings Joel | $280,000 | |
| Closed | Cummings Joel | $280,000 |
Source: Public Records
Tax History Compared to Growth
Tax History
| Year | Tax Paid | Tax Assessment Tax Assessment Total Assessment is a certain percentage of the fair market value that is determined by local assessors to be the total taxable value of land and additions on the property. | Land | Improvement |
|---|---|---|---|---|
| 2025 | $6,291 | $33,200 | $11,448 | $21,752 |
| 2024 | $6,291 | $31,321 | $10,144 | $21,177 |
| 2023 | $5,935 | $29,549 | $9,151 | $20,398 |
| 2022 | $5,899 | $40,440 | $14,400 | $26,040 |
| 2021 | $6,172 | $38,280 | $14,400 | $23,880 |
| 2020 | $5,856 | $36,600 | $14,400 | $22,200 |
| 2019 | $5,460 | $34,200 | $14,400 | $19,800 |
| 2018 | $4,722 | $24,624 | $12,682 | $11,942 |
| 2017 | $4,720 | $24,624 | $12,709 | $11,915 |
| 2016 | $4,576 | $24,624 | $12,709 | $11,915 |
| 2015 | $2,668 | $23,056 | $14,727 | $8,329 |
| 2014 | $2,668 | $21,751 | $15,323 | $6,428 |
Source: Public Records
Map
Nearby Homes
- 11176 180th St
- 188-07 Mangin Ave
- 179-07 Murdock Ave
- 186-16 Hilburn Ave
- 183-34 Fonda Ave
- 18823 Mangin Ave
- 188-25 Mangin Ave
- 187-44 Jordan Ave
- 112- 2 178th St
- 18833 Keeseville Ave
- 111-54 178th Place
- 183-29 Brinkerhoff Ave
- 112-13 178th St
- 183-12 Elmira Ave
- 188-45 Quencer Rd
- 188-31 Jordan Ave
- 17709 112th Ave
- 18908 114th Rd
- 187-15 Tioga Dr
- 17718 Sayres Ave
- 18511 Ilion Ave
- 18517 Ilion Ave
- 18511 Ilion Ave
- 18521 Ilion Ave
- 18505 Ilion Ave
- 18525 Ilion Ave
- 18402 Hilburn Ave
- 18406 Hilburn Ave
- 18410 Hilburn Ave
- 185-21 Ilion Ave
- 18414 Hilburn Ave
- 18527 Ilion Ave
- 185-27 Ilion Ave
- 18414 Hilburn Ave
- 184-06 Hilburn Ave
- 18418 Hilburn Ave
- 185-31 Ilion Ave
- 18531 Ilion Ave
- 111-20 Dunkirk St
- 18526 Ilion Ave