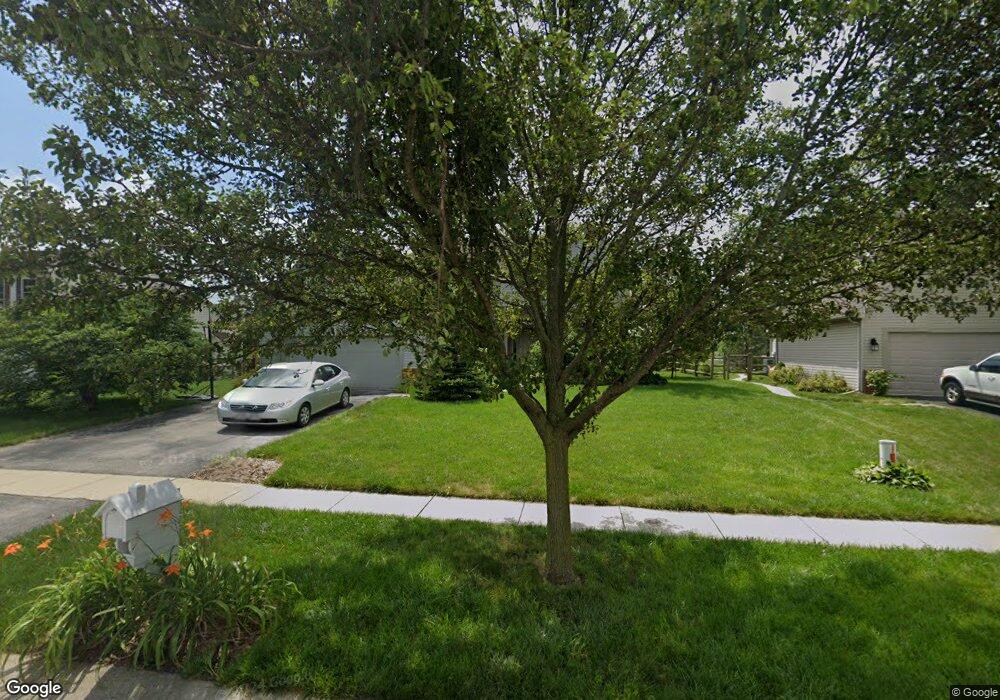
1852 Crossfields Rd Perrysburg, OH 43551
Estimated Value: $392,621 - $425,000
4
Beds
3
Baths
2,175
Sq Ft
$187/Sq Ft
Est. Value
About This Home
This home is located at 1852 Crossfields Rd, Perrysburg, OH 43551 and is currently estimated at $406,905, approximately $187 per square foot. 1852 Crossfields Rd is a home located in Wood County with nearby schools including Toth Elementary School, Perrysburg Junior High School, and Perrysburg High School.
Ownership History
Date
Name
Owned For
Owner Type
Purchase Details
Closed on
Oct 8, 2020
Sold by
Bandling Lars
Bought by
Burns Kathryn T
Current Estimated Value
Purchase Details
Closed on
Feb 8, 2018
Sold by
Bruns Nicole A
Bought by
Bruns Brent G
Purchase Details
Closed on
Sep 18, 2003
Sold by
Trellis Homes Llc
Bought by
Bruns Brent G
Home Financials for this Owner
Home Financials are based on the most recent Mortgage that was taken out on this home.
Original Mortgage
$140,000
Interest Rate
6.33%
Mortgage Type
Construction
Purchase Details
Closed on
Sep 5, 2003
Sold by
Louisville Title Agency For Nw Ohio Inc
Bought by
Trellis Homes Llc
Home Financials for this Owner
Home Financials are based on the most recent Mortgage that was taken out on this home.
Original Mortgage
$140,000
Interest Rate
6.33%
Mortgage Type
Construction
Create a Home Valuation Report for This Property
The Home Valuation Report is an in-depth analysis detailing your home's value as well as a comparison with similar homes in the area
Home Values in the Area
Average Home Value in this Area
Purchase History
| Date | Buyer | Sale Price | Title Company |
|---|---|---|---|
| Burns Kathryn T | -- | None Available | |
| Bruns Brent G | -- | None Available | |
| Bruns Brent G | $34,500 | Louisville Title | |
| Trellis Homes Llc | $172,500 | Louisville Title Agency For |
Source: Public Records
Mortgage History
| Date | Status | Borrower | Loan Amount |
|---|---|---|---|
| Previous Owner | Bruns Brent G | $140,000 |
Source: Public Records
Tax History Compared to Growth
Tax History
| Year | Tax Paid | Tax Assessment Tax Assessment Total Assessment is a certain percentage of the fair market value that is determined by local assessors to be the total taxable value of land and additions on the property. | Land | Improvement |
|---|---|---|---|---|
| 2024 | $6,357 | $109,865 | $15,050 | $94,815 |
| 2023 | $6,357 | $109,870 | $15,050 | $94,820 |
| 2022 | $5,498 | $85,960 | $12,810 | $73,150 |
| 2021 | $5,403 | $85,960 | $12,810 | $73,150 |
| 2020 | $5,375 | $85,960 | $12,810 | $73,150 |
| 2019 | $4,689 | $72,770 | $12,810 | $59,960 |
| 2018 | $4,162 | $72,770 | $12,810 | $59,960 |
| 2017 | $4,135 | $72,770 | $12,810 | $59,960 |
| 2016 | $3,972 | $66,850 | $13,440 | $53,410 |
| 2015 | $3,972 | $66,850 | $13,440 | $53,410 |
| 2014 | $4,006 | $66,850 | $13,440 | $53,410 |
| 2013 | $3,903 | $63,670 | $12,810 | $50,860 |
Source: Public Records
Map
Nearby Homes
- 1380 Brookwoode Rd
- 0 Brookwoode Rd
- 2837 Woods Edge Rd
- 670 Ridge Lake Ct
- 11 Hawthorne Crossing
- 158 Barton Creek Dr
- 168 Barton Creek Dr
- 162 Barton Creek Dr
- 142 Barton Creek Dr
- 144 Barton Creek Dr
- 140 Barton Creek Dr
- 549 Canterbury Blvd
- LOT 140 Canterbury Blvd
- 700 Delaware Dr
- 13975 Eckel Junction Rd
- 116 Wellington Place
- 122 Wellington Place
- 113 Wellington Place
- 117 Wellington Place
- 2106 Ashley Ct
- 1838 Crossfields Rd
- 1866 Crossfields Rd
- 2321 Woods Edge Rd
- 2311 Woods Edge Rd
- 2333 Woods Edge Rd
- 1880 Crossfields Rd
- 1853 Crossfields Rd
- 2301 Woods Edge Rd
- 2345 Woods Edge Rd
- 1867 Crossfields Rd
- 1837 Crossfields Rd
- 1810 Crossfields Rd
- 1892 Crossfields Rd
- 1881 Crossfields Rd
- 1825 Crossfields Rd
- 2357 Woods Edge Rd
- 2289 Woods Edge Rd
- 1811 Crossfields Rd
- 1800 Crossfields Rd
- 1893 Crossfields Rd